
The FOMC Meeting Approaches
Was the break above the long-running downtrend line a “head fake?” Maybe. However, before we get into the analysis, let’s review where we left off last week. Such is critically the case as we head into this coming week’s FOMC meeting and policy announcement.
The upcoming FOMC meeting will likely determine the market’s direction over the next few weeks. While many market participants are hoping for a “kinder, gentler Fed,” As noted previously, the recent commentary suggests such may not be the case.
“The most critical tidbit came from St Louis Fed president Jim Bullard (a non-voter this year), who spoke to the WSJ’s Fed Mouthpiece Nick Timiraos. He stated that while US interest rates have to rise further to ensure that inflationary pressures recede, ‘the US is now ‘almost’ in the restrictive territory.
That point was echoed by Loretta Mester, as the Fed wants to ensure inflation will come down on a steady path to the 2% target. ‘I just think we need to keep going, and we’ll discuss how much to do at the next meeting.’ Mester said that she expects the Fed’s policy rate to go ‘a bit higher’ than 5% and stay there for some time to slow inflation further.”
As we further noted, our concern remains that while the Fed is suggesting further tightening, the 3-month average of inflation has already returned to the Fed’s target rate. Such means the Fed is running a significant risk in overtightening policy and causing a sharper economic downturn than is currently priced into asset prices.

The reason for the rehash is this coming week’s FOMC meeting, where the Fed is widely expected to hike rates by 0.25%, will impact market direction. The risk to the markets is that while the bulls have been driving asset prices higher since the beginning of this year, that increase in price works against the Fed’s agenda. The goal of tighter monetary policy by the Fed is to tighten monetary conditions to slow economic growth, thereby reducing inflation. However, higher asset prices boost consumer confidence and loosen monetary conditions. As noted by Liz Ann Sonders, financial conditions have eased dramatically since October.

Per a speech Jerome Powell gave in early December:
“Officials seek to reduce inflation by slowing the economy through tighter financial conditions—such as higher borrowing costs, lower stock prices, and a stronger dollar—which typically curb demand.”
Given that “easier” financial conditions risk keeping inflation elevated, it will not be surprising to see Jerome Powell deliver a starkly hawkish message next week. Such was what Powell did following previous market rallies in September and December to push markets lower and tighten financial conditions.
This brings us to this week’s analysis. Was this week’s technical breakout valid and leading to a further market advance, or was it just another “head fake?”
Just Another “Head Fake?”
Over the last few weeks, we repeatedly discussed the consolidation occurring in the market. The compression of prices between the downtrend line from the January 2022 peak and the rising lows since October was an important focal point for investors. Such is shown in the chart below.
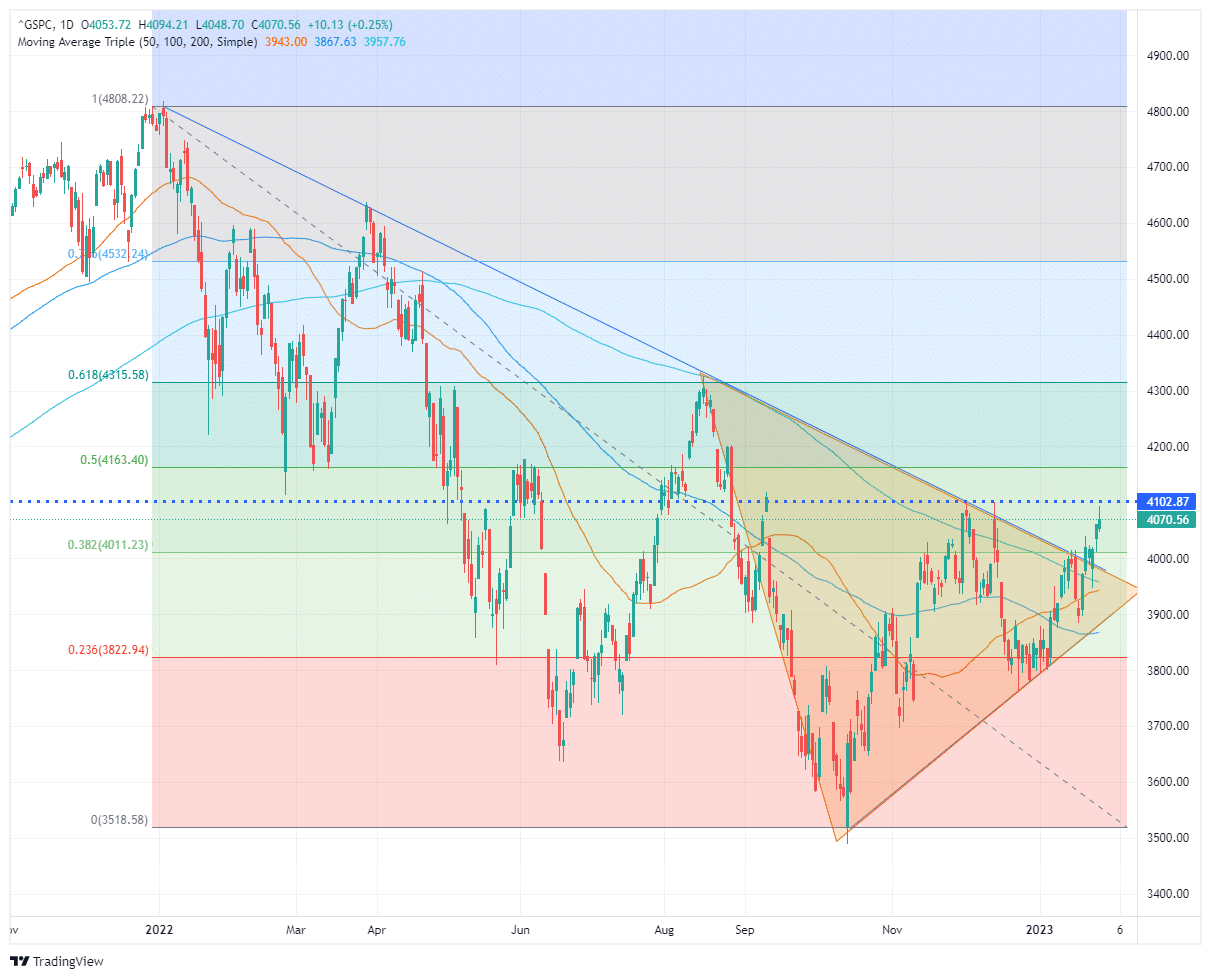
As you will note, since January’s market peak, each attempt to break above the falling downtrend line was a “head fake,” leading to lower prices. The good news is that, eventually, this cycle will end. At some point, the market will effectively “price in” the worst outcomes, and a break above the downtrend line will become sustainable. Such will confirm the beginning of a new bullish cycle for prices.
The evidence of a clear sustained break above the downtrend is not evident. That keeps the risk of a “head fake” higher for now. But, as shown below, several technical improvements to the broad market are worth watching.
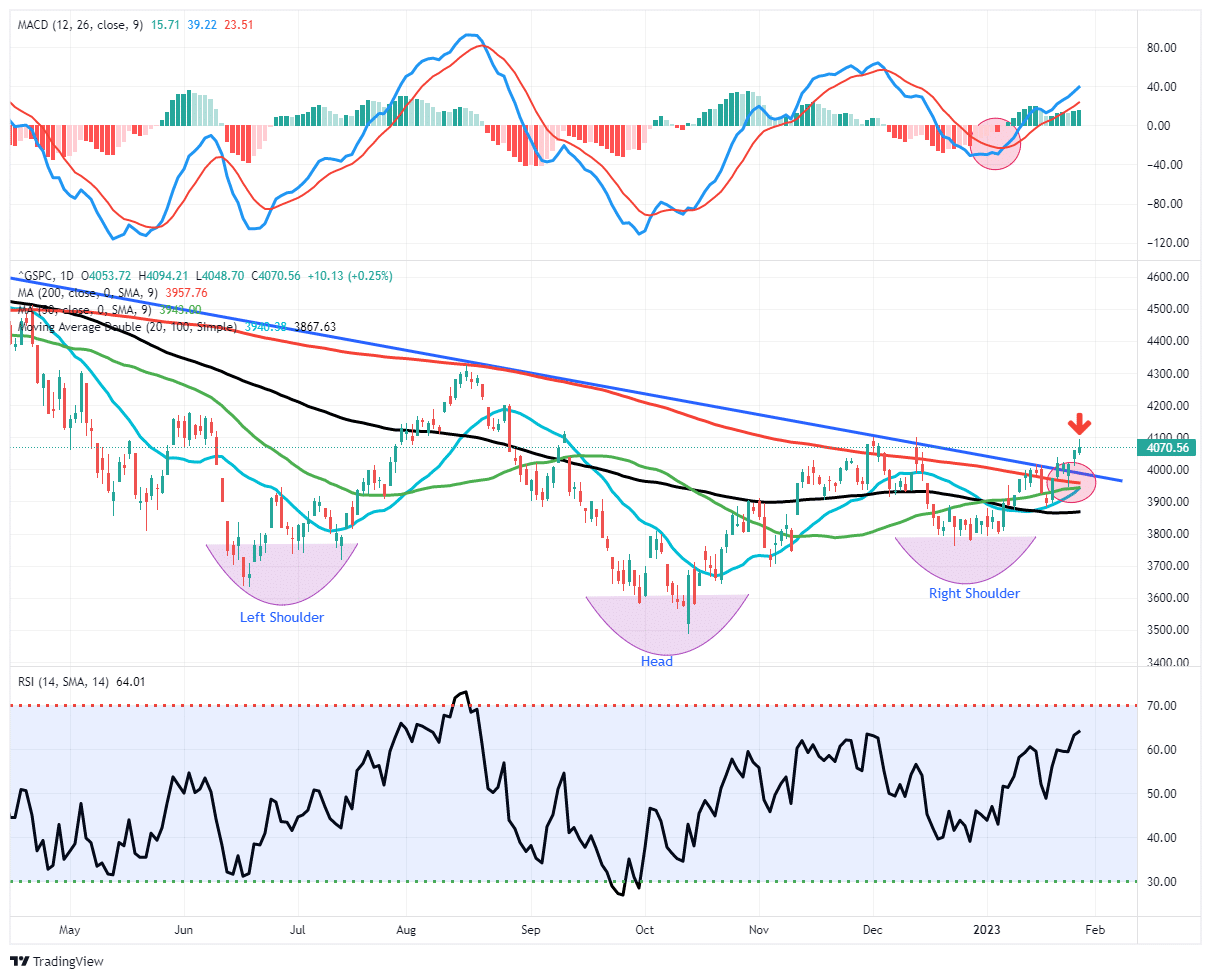
While the flow of economic news and media headlines are filled with stories of an impending recession, the market has been firming since October, suggesting a potentially different outcome. As we noted, the inverse “head-and-shoulder” pattern already suggests a market bottom has formed. A solid break above the downtrend line (with a successful retest) would confirm the completion of that pattern.
Furthermore, the market is not extremely overbought, and shorter-term moving averages are slopping positively. Notably, the 50-DMA is rapidly closing in on a cross above the declining 200-DMA. Such is known as the “golden cross” and historically signifies a more bullish setup for markets moving forward.
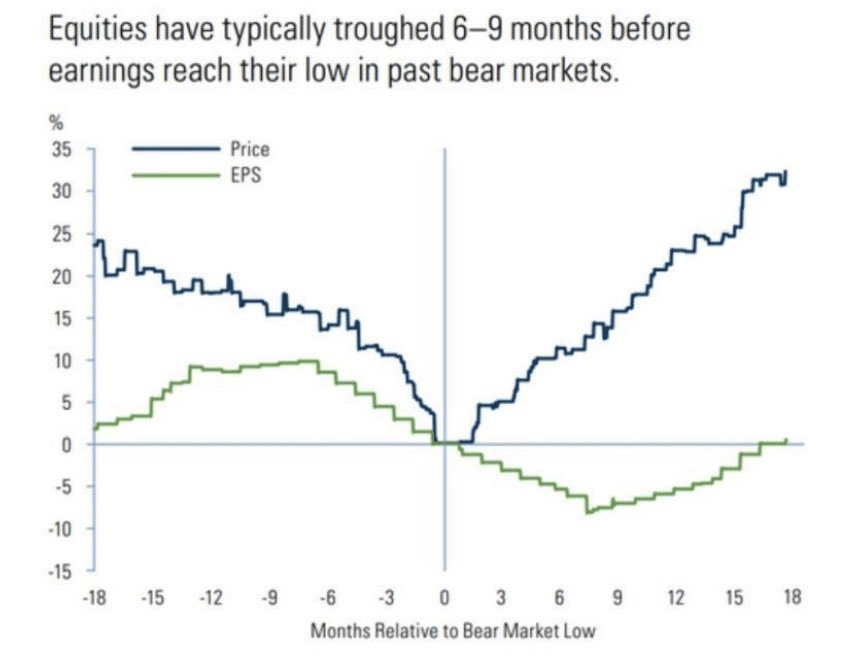
While it is possible that some bad news or an overly aggressive Fed could cause a “head fake” short-term, many of these bullish signals will complete in the months ahead. While that seems odd given the negative flow of economic and earnings data near term, historically, market prices tend to trough 6-9 months before earnings bottom. Such is because the market anticipates outcomes and was the subject of this week’s post on “Contrarianism.”
“As a contrarian investor, excesses get built when everyone is on the same side of the trade. Everyone is so bearish the markets could respond in a manner no one expects. This is why equities have historically bottomed between 6-to-9 months before the earnings trough.”
There are plenty of reasons to be very concerned about the market over the next few months. Given the market leads the economy, we must respect the market’s action today for potentially what it is telling us about tomorrow.
While this may be a “head fake” currently, I wouldn’t entirely dismiss the message of improving technicals either.
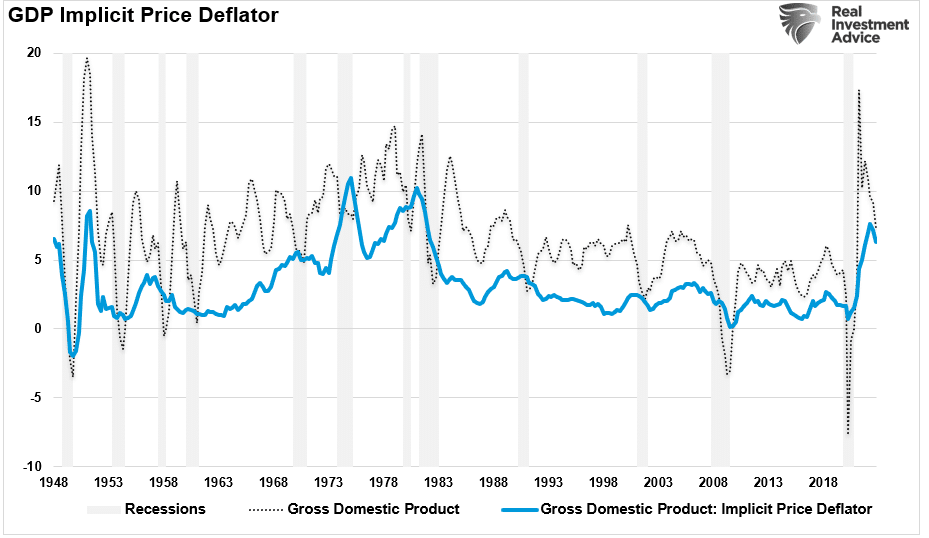
Q4 GDP Stronger Than Expected
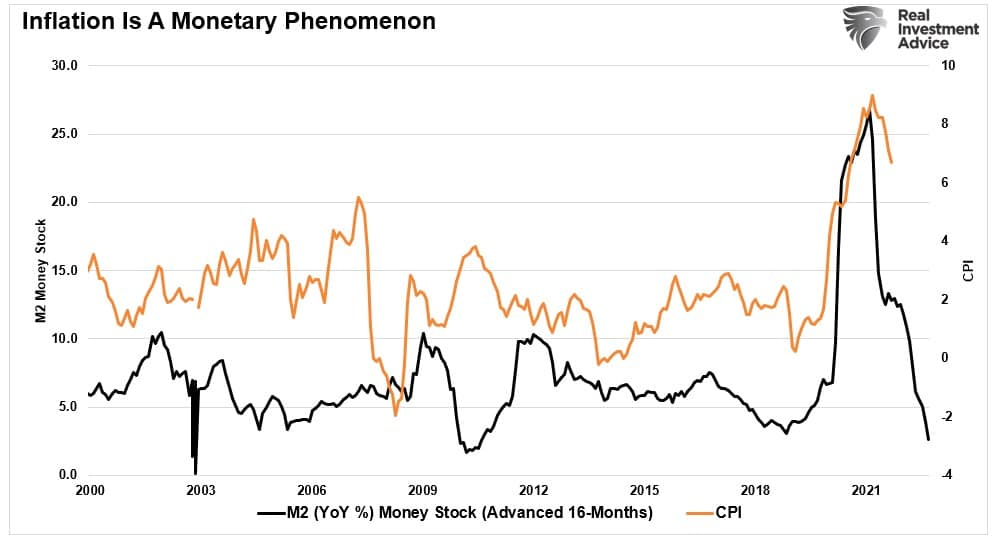
On Thursday, the Bureau of Economic Analysis reported the first estimate of the gross domestic product for Q4 2022. The initial read was stronger than expected on two fronts. The actual measure of economic growth was 2.9% annualized for 2.6% expected, but the inflation measure was also stronger at 3.5% versus 3.2%.
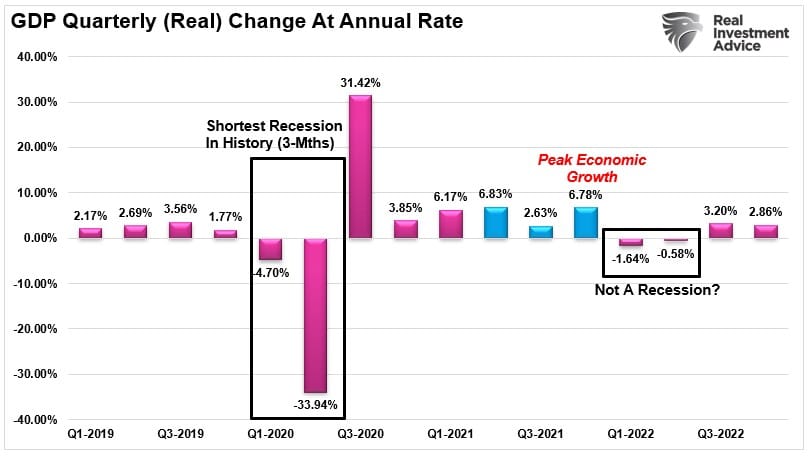
For the year, the economy grew slightly below 1%. Such does not allow the economy to slow without slipping into a recession. As Mish Shedlock noted:
“Money supply is falling off a cliff, another sign of economic weakness.”
That is a critical point, as the surge in monetary supply kept the economy afloat last year. However, that “pig in the python” is now exiting rapidly, exposing the underbelly of the economy. Such will also exacerbate the slowdown when the lag effect of monetary policy catches up with consumers.
The Soft Landing Scenario
While ignored by the market, that stronger deflator will likely cause heartburn for the Federal Reserve heading into the FOMC meeting next week. As noted above, with monetary policy conditions easing sharply, the market rally is working against the Fed’s attempt to reduce inflation.
Nonetheless, the stronger-than-expected GDP report feeds into the “soft landing” scenario. As we discussed on Friday, the definition of a “soft landing” is:
“A soft landing, in economics, is a cyclical slowdown in economic growth that avoids a recession. A soft landing is the goal of a central bank when it seeks to raise interest rates just enough to stop an economy from overheating and experiencing high inflation without causing a severe downturn.” – Investopedia
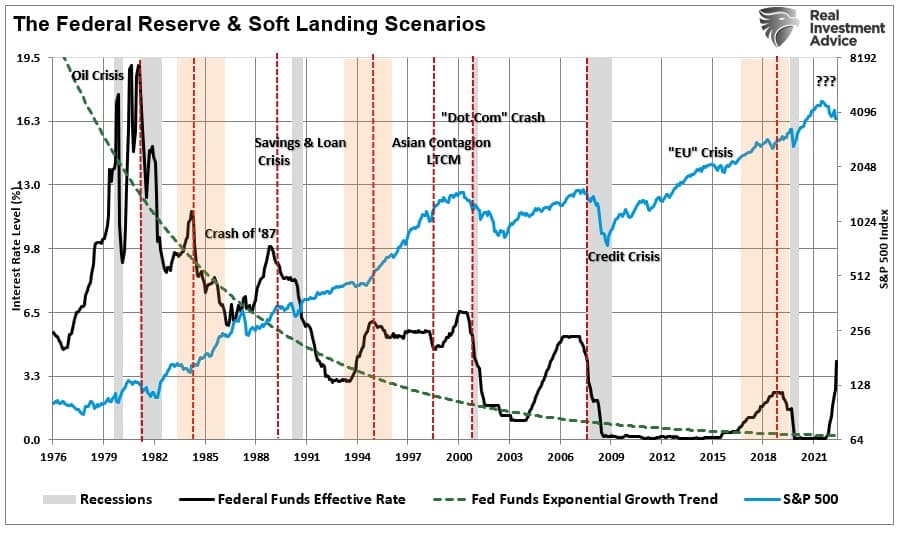
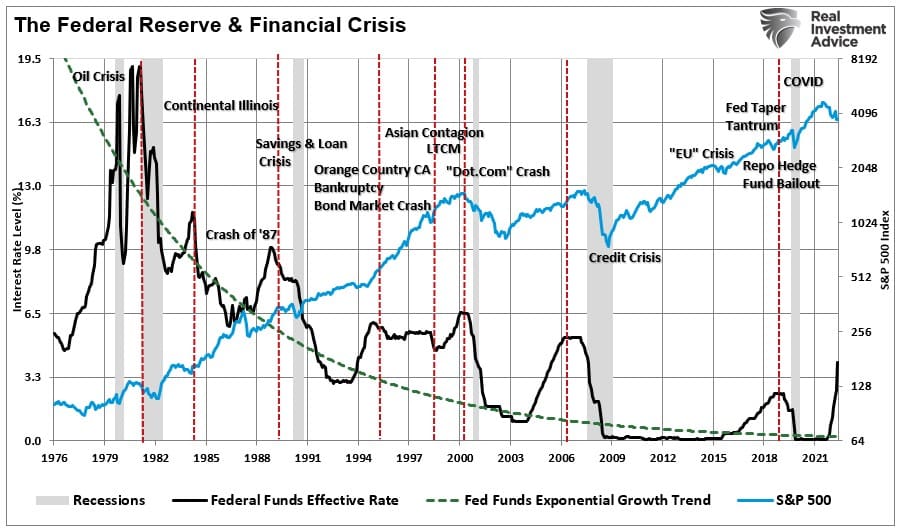
The term “soft landing” came to the forefront of Wall Street jargon during Alan Greenspan’s tenure as Fed Chairman. He was widely credited with engineering a “soft landing” in 1994-1995. The media has also pointed to the Federal Reserve engineering soft landings economically in both 1984 and 2018.
The chart below shows the Fed rate hiking cycle with “soft landings” notated by orange shading. I have also noted the events that preceded the “hard landings.”
There is another crucial point regarding the possibility of a “soft landing.” A recession, or “hard landing,” followed the last five instances when inflation peaked above 5%. Those periods were 1948, 1951, 1970, 1974, 1980, 1990, and 2008. Currently, inflation is well above 5% throughout 2022.
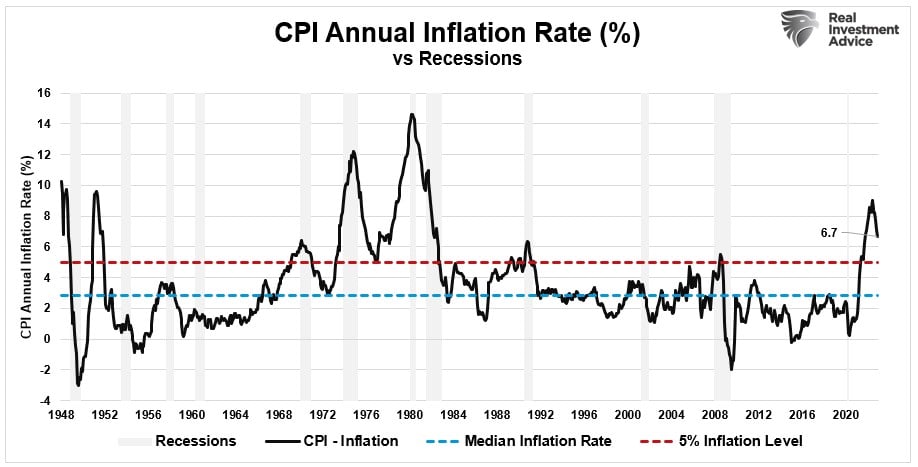
Could this time be different? Absolutely, but there is a lot of history that suggests otherwise.
Furthermore, the technical definition of a “soft landing” is “no recession.“ The track record worsens if we include crisis events caused by the Federal Reserve’s actions. As noted above, there were three periods where the Federal Reserve hiked rates and achieved a “soft landing,” economically speaking. However, the reality was that those periods were not “pain-free” events for the financial markets. The chart below adds the “crisis events” that occurred as the Fed hiked rates.
The point is that the “bull versus bear” argument is not resolved.
This is why, at least for now, we are allowing the technical formations to drive investment decisions in the short term. However, we fully expect the fundamental realities to emerge by this summer, which is why we remain cautious.
How We Are Trading It
It is a very confusing and challenging market to navigate currently. Last year, defense won the game, with Dow outperforming the Nasdaq by the widest margin in over two decades. This year, the Nasdaq is up more than 9%, and the “Generals” have re-emerged as market leaders.
Yet, this all occurs against a fairly dismal backdrop of data, as discussed in our recent post on “Contrarianism:”
- The Fed is remaining aggressive on monetary policy.
- Central banks are reducing liquidity to markets.
- Inflation remains problematic.
- Earnings remain elevated.
- The economy is slowing.
- Consumers are running out of savings.
We certainly agree with the more dismal outlook and continue to suggest that investors should be more cautious in their portfolio allocations. However, this is also the point where investors make the most mistakes. Emotions make us want to avoid all risks of loss. That is why investors almost always “sell” at the bottom of markets when they should buy.
Such is the point where we are today. There are lots of reasons to be bearish. However, the technical improvements in the market suggest investors should be buying. It’s hard. It also doesn’t mean it will immediately work, as the markets could correct first before the final bottom.
But this is the risk of investing. To make money investing in the financial markets, you have to put capital at risk of losing it. No “risk-free” investment will provide substantial rates of return over the long term. The question that investors must answer for themselves is how much of the “risk” has been removed from the financial equation.
Unfortunately, no one knows the answer. All we can do is make our best guess.
And that is the hard part.
Such is why over the last three weeks, we have repeatedly discussed the technical improvement of the market and the message it was sending. That technical improvement continues to push us to increase exposure cautiously. As noted last week:
“We did add some equity exposure this past week by adding back some of our energy positions we sold near recent peaks and a trading position in the S&P 500 equal weight index. We are also contemplating an increase in the duration of our bond portfolio following the most recent CPI report. The spread now between Treasury bonds, and the 3-month rate of inflation has now become extremely attractive. As we noted previously, there is a rising probability that bonds will outperform stocks in 2023. Such will result from disinflation becoming a deflationary (read: recessionary) environment.”
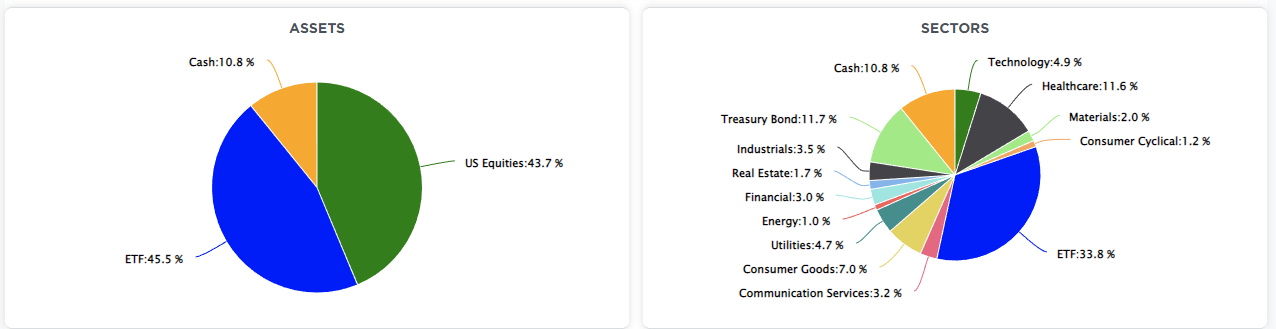
We continued to add exposure this week on the equity side of the portfolio and further reduced our overweight position in cash. We remain underweight in stocks and bonds and heavy cash and short-term Treasuries. (The ETF allocation comprises short-duration Treasury bonds and floating rate Treasuries, with a lesser allocation to long-dated Treasuries. You can view our models in real-time at SimpleVisor.com)
As we add exposure, we continue to tighten up stop-loss levels, hedging our portfolios as needed and looking to rebalance the portfolio back to target weightings.
Until the market confirms the “bear market” is over, we continue to trade cautiously. We DO NOT have to be early for the next bull market. When it comes, there will be plenty of time to participate in it and grow capital successfully.
See you next week.
BullsNBears.com was founded to educate investors about the eight secular bear markets which have occurred in the US since 1802. The site publishes bear market investing recommendations, strategies and articles by its analysts and unaffiliated third-party and qualified expert contributors.
No Solicitation or Investment Advice: The material contained in this article or report is for informational purposes only and is not a solicitation for any action to be taken based upon such material. The material is not to be construed as an offer or a recommendation to buy or sell a security nor is it to be construed as investment advice. Additionally, the material accessible through this article or report does not constitute a representation that the investments or the investable markets described herein are suitable or appropriate for any person or entity.