
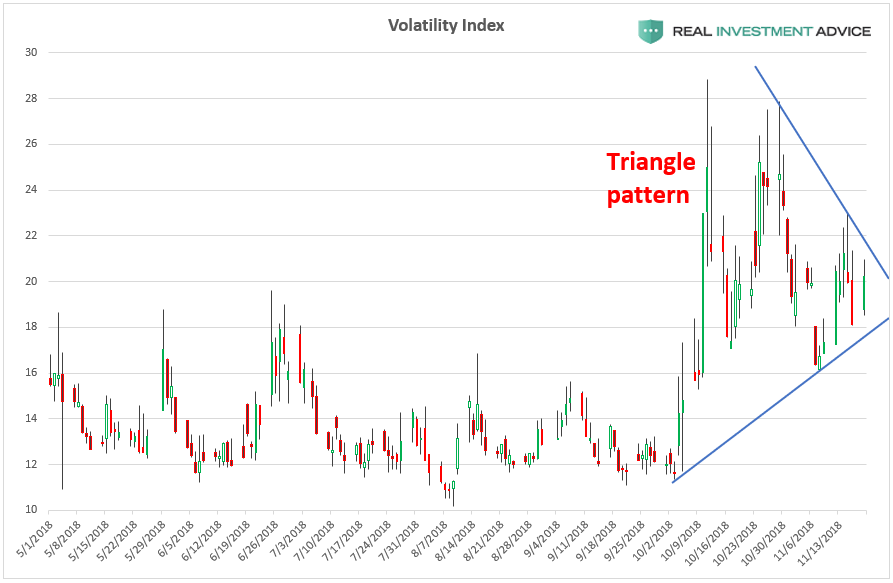
The chart below shows the VIX Volatility Index, which appears to be forming a triangle pattern that may indicate that another big move is ahead. If the VIX breaks out of this pattern in a convincing manner, it would likely lead to even higher volatility and fear (which would correspond with another leg down in the stock market). On the other hand, if the VIX breaks down from this pattern, it could be the sign of a more extended market bounce or Santa Claus rally ahead.
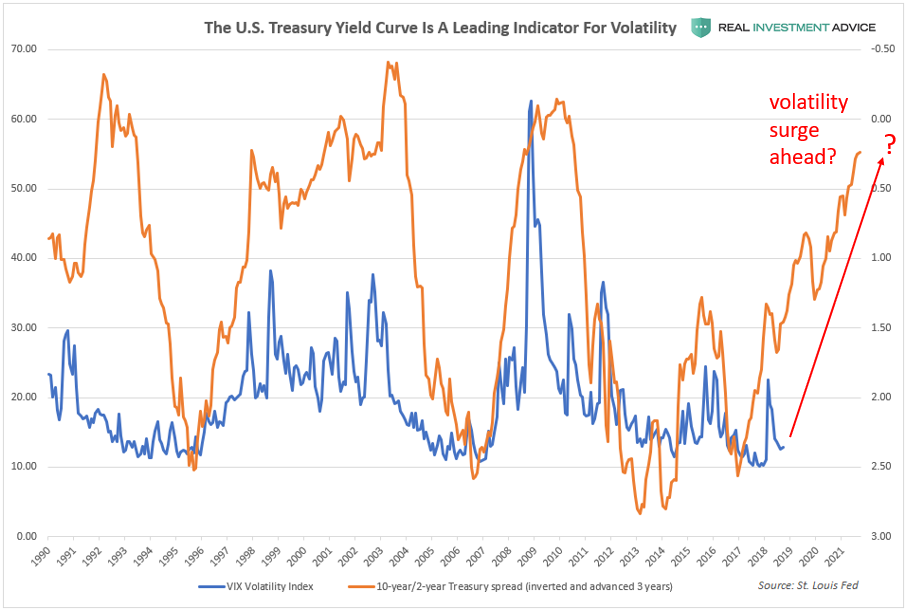
In my early-October volatility warning, one of the charts I showed was the inverted 10-year/2-year Treasury spread and how it leads the VIX by approximately three years. According to this logic, the January and October volatility spikes were only the beginning of a much larger bullish volatility cycle (ie., one that accompanies a full-blown bear market).
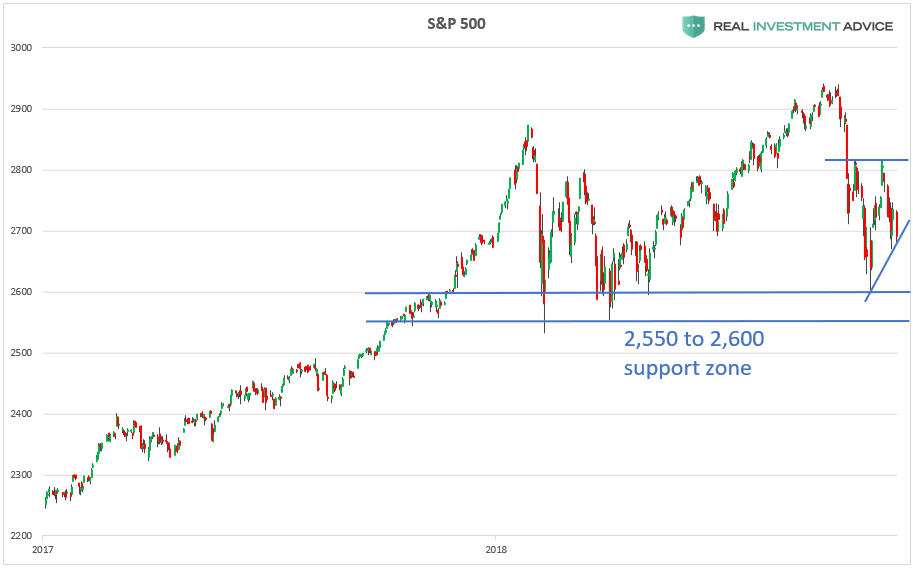
If the VIX breaks to the upside, it would coincide with the S&P 500 testing its 2,550 to 2,600 support zone that formed at the early-2018 lows. As I’ve said in the past, if the S&P 500 breaks that support zone in a convincing manner, an even more extensive bearish move is likely to occur.
For now, I am watching which way the S&P 500 and VIX break out for confirmation.
Please follow me on LinkedIn and Twitter to keep up with my updates.
The BullsNBears.com website was founded by market crash expert Michael Markowski to specialize at publishing articles by him and by other authors who have been screened. The articles pertain to market crashes, market bottoms and recessions and depressions. Register below to be alerted when a new article is published on BullsNBears.com.