
The simultaneous double-digit declines for the stock markets of four of the world’s developed countries from February 20 to February 28, 2020 was not only an historic event; but unfortunately, ominous in that it portends dire financial times ahead.
Based on empirical data and statistics the probability is 100% that the US, German, Japanese and Canadian stock markets will decline by 34% from their 2020 highs by Easter. The probability for a 77% decline before exceeding their 2020 highs is 66%.
What caused the double-digit corrections for the five indices and their soon to be crashes was not the Coronavirus. It was the bidding up of the shares of the four trillion-dollar valued tech stocks to ridiculous prices. See “Overvalued stocks, freefalling US Dollar to soon cause epic market crash!”, March 5, 2020.
The fact that four of the five indices traded at historic highs on February 19, 2020 is extremely troubling. Clearly, the crash that will soon occur is not your garden variety crash. See also, my March 5, 2020 article “Overvalued stocks, freefalling US Dollar to soon cause epic market crash!”

My predictions, based on my statistical research, on how markets behave after minimum swift corrections of 10% and my 43 years of experience:
- All of the indices will decline by a minimum of 34% from their February highs.
- The first worldwide recession has begun.
- The US and most of the world’s governments will have to bail out their airlines.
- The Secular bull market which began in March 2009 ended on February 19th.
- The 9th secular bear since 1802 began on February 20th.
The stocks markets for countries simultaneously reaching all-time highs and then declining by 10% or more within 10 days is unprecedented. However, there have been cases of this occurring for the US markets. For all three cases, the corrections became crashes with minimum declines of 34% within two to 25 days after the corrections commenced.

Statistical probabilities for the indices of the four countries based on the 1929, 1987 and 2000 crash statistics:
- 100% probability for minimum declines of 34%
- 66% probability for declines of 44% from 2020 peaks to troughs
- 66% probability for declines of 77% before getting back to all-time highs
- 100% probability it will take 1½ to 25 years before exceeding February 19, 2020 highs
- 66% probability that indices will bottom in Q4 of 2022
The significant declines coming for the indices of the four developed countries has increased the likelihood of an epic global market crash. Crashes which begin in a particular country can become viral and cause crashes in other countries. The 10% plus correction for the Dow Jones composite index, which began on October 5, 1987, is a good example. The Dow’s correction spread to the Nikkei and its decline of 21% began on October 14, 1987; the day after it reached its all-time high. The interaction between the US and Japanese markets likely fueled the infamous “Black Monday” crash which occurred on October 19, 1987.

The crashes which began for the Dow in 1929 and the NASDAQ in 2000 occurred at the end of secular bulls and the beginning of secular bear markets. The Dow’s 1987 Black Monday crash caused minimal damage to the secular bull which began in 1982 for two reasons:
- At the age of five years old, the secular bull was an adolescent. Since 1802, the minimum lifespan of a secular bull or bear has been eight years.
- The fall of communism, which began in 1989, helped the 1982-2000, secular bull to climb back above its October 1987 pre-crash high by July of 1989

Since the Dow’s 1987 Black Monday crash occurred two days after the index’s 10% correction, most investors did not have an opportunity to get out. However, after the 1929 Dow and 2000 NASDAQ had corrected by 10%, investors had opportunities to sell out.
After the NASDAQ, in 2000 declined by 11% from March 5th to 15th, investors had until March 29, 2000 to sell out before the index began to plumb new lows.
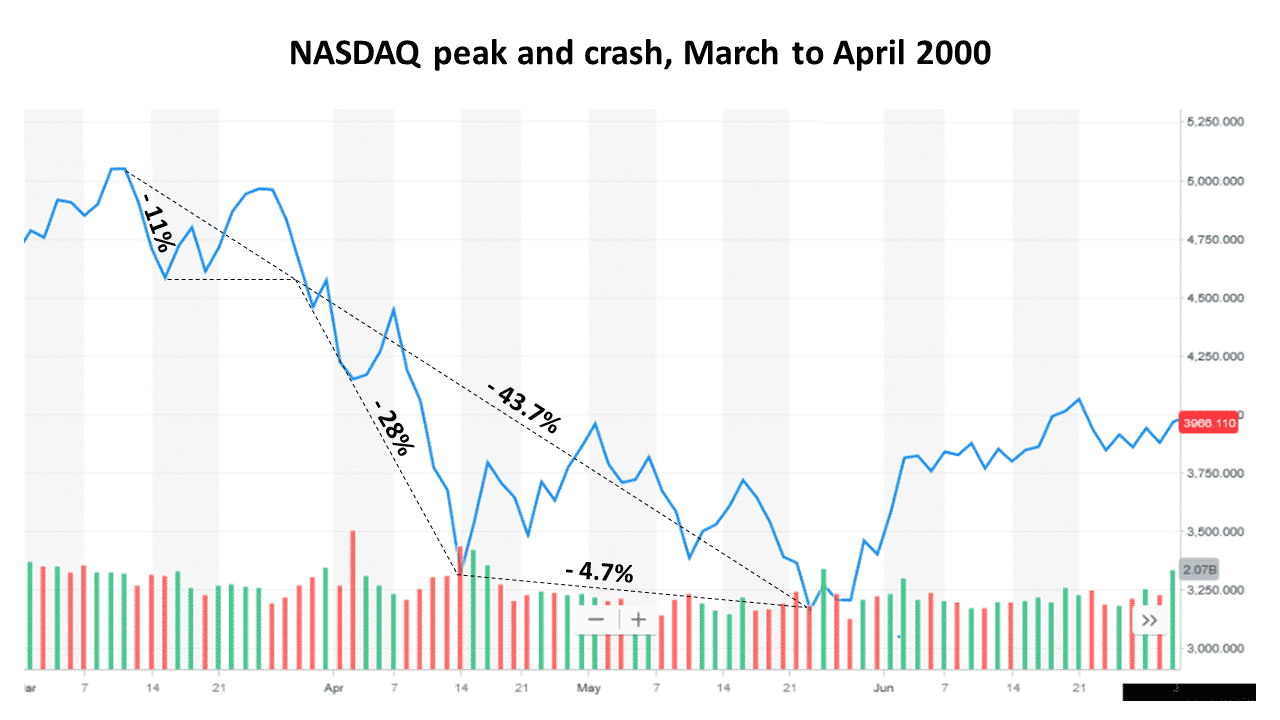
On April 14, 2000, which was 25 days after the correction began, the NASDAQ had declined by 34%. It took the Dow 10 days to reach the 34% decline threshold from October 17, 1929, after its initial 10% correction occurred within a 5-day period.
From researching the 1929 crash and 2000 dotcom bubble crash the indices will decline by more than 70% from their peaks and hit their bottoms sometime in the fourth quarter of 2022. The 1929 crash bottomed in 32 months and the NASDAQ 30 months after their corrections began.
The February 19, 2020, correction is especially worrisome for the US stock market and economy. The NASDAQ and S&P 500 were the top performing of the five global indices for the 12 months ended February 19,2020.

For the 12 months prior to the to the dotcom bubble bursting in March of 2000, the S&P 500 lagged the NASDAQ and the three foreign indices. The low performance of the index mitigated the negative impact that the collapsing NASDAQ could have had on the US economy.

The S&P 500’s underperforming was a blessing since for the 12 months ended March 2001, its 12% decline was much lower than the rates of decline for the five other indices.

The post 10% swift correction from a market peak behavior for precious metals further support my findings for the equities markets. Since 1979 the prices of both gold and silver each corrected swiftly by 10% or more twice. On all four occasions the prices of the precious metals went on to crash by a minimum of 34% after experiencing minimum 10% corrections within the same time frames as the two Dow crashes and the NASDAQ crash.

My prediction is that the S&P 500’s secular bull market which began in March 2009 ended on February 19, 2020. The ninth secular bear since 1802 began on February 20th. Based on the peaks of the last three secular bull markets as compared to the troughs of the of the three most recent secular bears, the S&P 500 could decline by an additional 47% to 80% from its March 6, 2020 close.

The video of my “Secular Bulls & Bears: Each requires different investing strategies” workshop at the February 2020 Orlando Money Show is highly recommended. The educational video explains secular bulls and bears and includes strategies to protect assets during secular bear markets and recessions, etc.
BullsNBears.com which covers all of the emerging and declining economic and market trends is an excellent resource site. Click here to view one-minute video about the site.
A strategy to liquidate all mutual fund holdings and the majority of all stock holdings should be deployed immediately. Time is of the essence. To understand why diversification does not work and why penny and low-priced stocks should be held watch Money Show workshop video.
To maximize the liquidation amounts a registered investment advisor (RIA) who has been vetted by BullsNBears.com should be utilized. The advisor must have the expertise to technically trade the market so that higher liquidation prices can be obtained. Since any referred RIA will be able to utilize the Bull & Bear Tracker’s signals to manage a portion of a portfolio, losses could quickly be recouped. Its because the Bull & Bear Tracker produces significant profits in declining and in volatile markets. Read this “Big story is not “Bull & Bear Tracker’s 5% gain vs S&P 500 loss” for January 2020” article.

To be referred to an advisor please click the button below
The 2:50 video below provides details on my track records for predicting bankruptcies, market crashes and rallies at crash-bottoms.