
The market indices of the US, Japan, South Korea, Canada, France and Germany and the share prices for many of the world’s largest companies including Apple and Microsoft are at the tipping point. Stocks and indices reached their post-crash and relief rally closing highs from March 25th through March 27th.
None of the indices for the six countries has since closed above their highs. Since making their relief rally highs all eight of the indices have declined by 4.2% to 7.4%.

With each new passing day that the indices are unable to get new post-crash highs, the probability increases that they will careen back to and through their March 2020 lows.
Investors now need to make a decision; stay in the roller coaster or get out?
From my empirical research on the prior notable market crashes in early March 2020, I discovered that the 1929 crash and the bursting of the NASDAQ dotcom bubble in 2000 share the same genealogy as the crashes of the markets of the six countries which have been underway. The discovery was significant. It enabled the events chronology throughout the lives of the 1929 and 2000 crashes to be utilized to forecast the events for the crashes of six countries which are now underway and future crashes. For more about the genealogy read 03/23/20 “Probability 87% that market is at interim bottom” article.
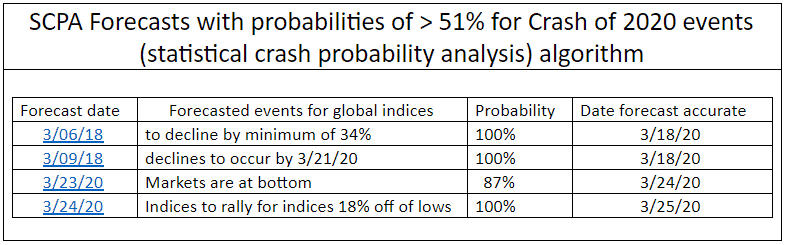
The table below contains the first four precisely accurate forecasts that were made from the statistical crash probability analysis’ (SCPA). The SCPA was developed from the findings from my empirical research of the most notable market crashes since 1929.
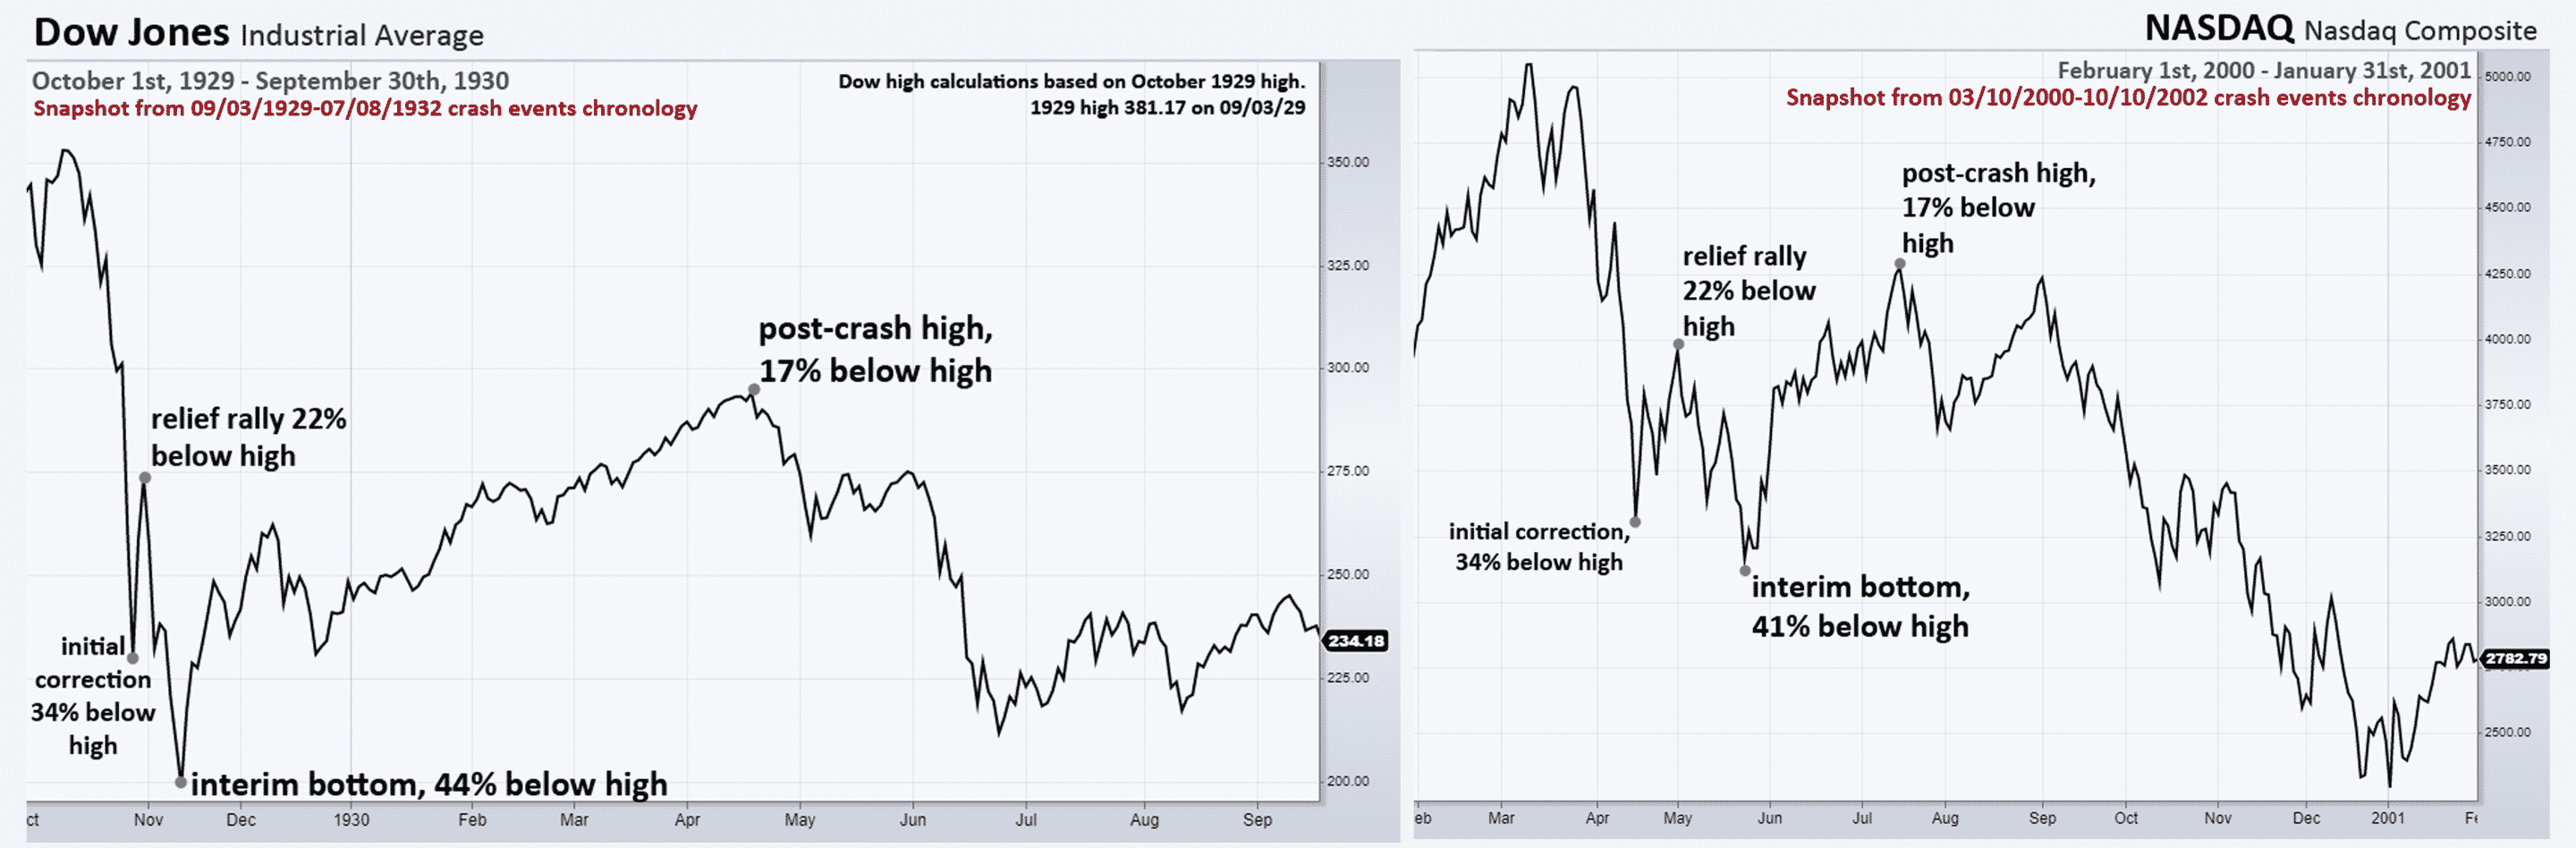
The charts below depict the almost identical chronology for the post-crash events that occurred after the Dow Jones crashed in 1929 and the NASDAQ dotcom bubble burst in 2000. The journey to the final bottom took the Dow 32 months and the NASDAQ 31 months. The NASDAQ declined by 78% and the Dow by 89% from their highs.
The “2020”, year to date charts of the US’ Dow Jones, S&P 500 and NASDAQ indices below depict their crash chronologies from February 20th through March 27th. Again, the chronologies of the 2020 crashes and the 1929 Dow and 2000 NASDAQ crashes though their initial correction and relief rally periods are very similar.

It was no surprise that the chart patterns for Microsoft and Apple mimic the three US indices. The two companies are the largest members of all three. Since they have significant index weightings, wherever the indices go, they will follow.

The above charts and tables provide the rationale as to why the eight indices of the six countries will soon begin their marches to the following in sequence:
- new lows
- interim bottoms
- interim highs
- final bottoms in Q4 2022 with declines ranging from 78% to 89% below 2020 highs
According the Statistical Crash Probability Analysis’ (SCPA) forecasts the probability is 100% that:
- The relief rally highs for markets of the six countries have either already occurred or will occur by Friday, April 3, 2020.
- The eight indices will reach new 2020 lows by April 30, 2020.
To be clear. Those who are still invested in stocks, mutual funds, and ETFs need to give serious consideration as to whether or not they want to stay on the wild roller coaster. The ride will take everyone to the interim bottoms which will be within 41% to 44% of the eight indices’ 2020 highs.
After reaching the bottom the indices will then ricochet back to and through the recent relief rally highs and to the post-crash highs according to the SCPA’s forecast. What will likely power the heart-pounding ride to the top is news about a cure or vaccine for the Coronavirus. This is will enable those who choose to stay on the rollercoaster to be able to liquidate at higher prices. After the post-crash high has occurred the SCPA’s probability is 100% that the indices will then reverse to begin their descents to the final bottom which will 79% below their 2020 highs. The probability is 50% for the bottom to be within 89%
The virus did not cause the crash. It caused the correction for markets which were ripe for an epic market crash. Therefore, the probability is extremely low that good news about the virus will be enough to drive the markets back to new all-time highs. See my March 5, 2020 article “Overvalued stocks, freefalling US Dollar to soon cause epic market crash!”.
The SCPA is also forecasting a 100% probability for the key on the horizon events of the crash of 2020 below to occur in the sequence below. The events and their probabilities are applicable to the eight indices of the six countries and for their largest members including Microsoft and Apple, etc.
- Interim bottom by or before May 4, 2020
- At interim bottom market will be 41% to 44% below 2020 highs
- Post-crash high before the journey begins to final Q 4 2022 bottom will occur by as early as June 24, 2020 and by as late as September 18, 2020.
- Post-crash highs to get market to within 17% of 2020 highs.
My only argument with the SCPA’s statistical probability analyses is can the markets get back to above or even to their March/April 2020 post-crash relief rally highs? The simultaneous crashes in multiple markets for more than one country, let alone six countries, is historically unprecedented.
My hunch is that the damage to the markets and economies of the world’s leading developed countries will be much more severe than the damage caused by the 1929 crash. The relief rally highs could prove to be the post-crash highs.
Should the recent highs be the post-crash highs, according to the SCPA the probability is 100% that it will take the markets a minimum of 15 years to get back above the highs reached during the week ended March 27, 2020. Additionally, the findings from my extensive research on all of the secular bear markets since 1929 further support the SCPA’s forecast.

In addition to my empirical research of notable crashes, I also have been conducting empirical research on the Dow’s biggest one day gains from 1901 to 2020. Based on my findings the probability is 94.4% that the Dow’s media sensationalized gains for the week ended March 27, 2020 were bear market rallies. See, “The TRUTH about Dow’s ‘… one day jump since 1933”.
Everyone should take advantage of markets being in close proximity of their post correction highs to exit the markets. All mutual funds and stocks over $5.00 per share should be liquidated. I will provide my rationale for holding and also for buying low priced and penny shares in a future article. My suggestion is to utilize a methodical approach by liquidating 20% of all holdings per day from April 1st to April 8th.
There are only three reasons why anyone would want to hold on to their stocks and mutual funds:
- Waiting to get back to break even. It’s against human nature to take losses. I knew investors in the 1970s who had been waiting for 10 to 20 years for a blue chip to get back to their purchase price. Bite the bullet.
- Not wanting to pay capital gains. Securities with gains can be “sold short against the box” to delay a taxable capital gain. Capital gains taxes will only go up from here.
- Financial advisor advising otherwise. Beware of the following:a) An advisor’s largest percentage fee that can be charged is for the amount that an investor has in stocks. If the investor is in cash the advisor can-not charge the fee.
b) The majority of financial advisors are affiliated with big brand name firms including Merrill Lynch, Morgan Stanley, Goldman Sachs and UBS, etc. These advisors have to follow the party line. They do not have the independence to get their clients out of the market even if they wanted to.
c) The financial services industry utilizes propaganda to keep clients in the market during volatile periods. Read “No One Saw It Coming’ – Should You Worry About The 10-Best Days” by Lance Roberts. He is among a few of the independent advisors who I know which had his clients’ 90% out of the market.
Read my March 31, 2020, article entitled “Embrace the Bear” to learn about:
- investing strategies that are best utilized during bear markets
- investing in ETFs which go up when the market goes down
- algorithms including the Bull & Bear Tracker and SCPA ’s which are being utilized by investors
Forward this article to everyone you know who has stocks, mutual funds and a retirement account. Everyone needs to understand that the probability is high for the market to decline by 79% from the high of this year to 2022. Subscribe to be alerted when my future crash of 2020 articles are published.