
In this week’s “Technically Speaking,” I want to review the bull case, which is seeming built on “Unicorns” and “Rainbows,” as opposed to the more bearish fundamental backdrop. We are uncomfortably “long equities” in this momentum-driven market, essentially making us “fully invested bears.”
Let’s review the “Bull” and “Bear” case from last week:
The Bull’s Case
The bullish case for the market is pretty thin.
- Hopes are high for a full reopening of the economy. (Rainbow)
- A vaccine. (Rainbow)
- A rapid return to economic normalcy. (Rainbow)
- 2022 earnings will be sufficiently high enough to justify “current” prices. (Let that sink in – that’s two years of ZERO price growth.) (Rainbow)
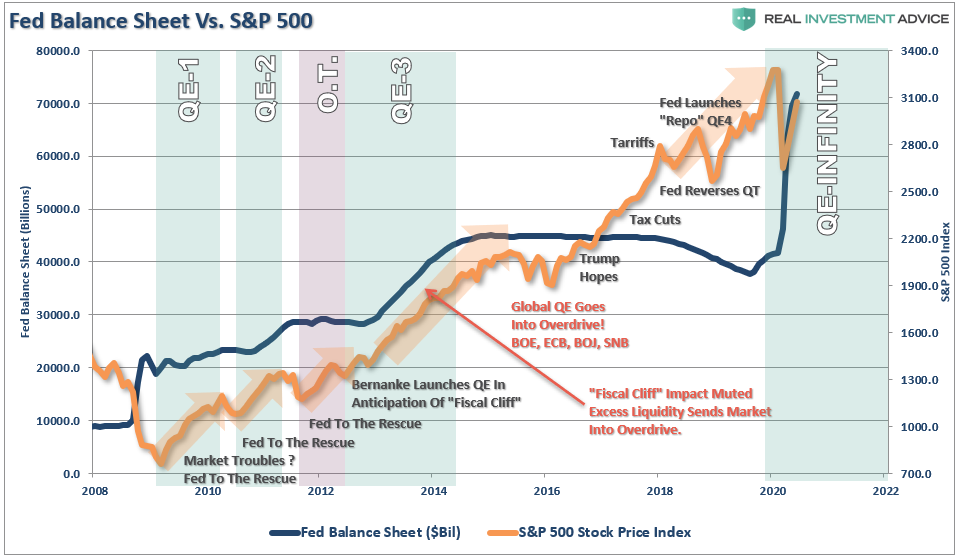
- The Fed. (Unicorn)
In actuality, the first four points are rationalizations. It is the Fed’s liquidity driving the market.
The Bear’s Case
The bear’s built their case on more solid fundamental views.
- The potential for a second wave of the virus
- A slower than expected economic recovery
- A second wave of the virus erodes consumer confidence slowing employment
- High unemployment weighs on personal consumption
- Debt defaults and bankruptcies rise more sharply than expected.
- All of which translates into the sharply reduced earnings and corporate profitability.
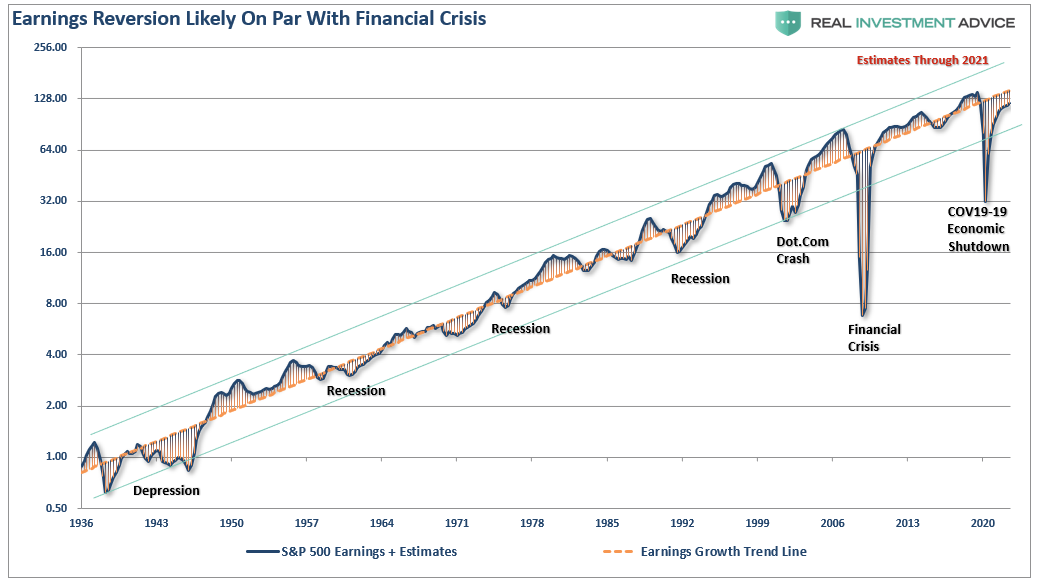
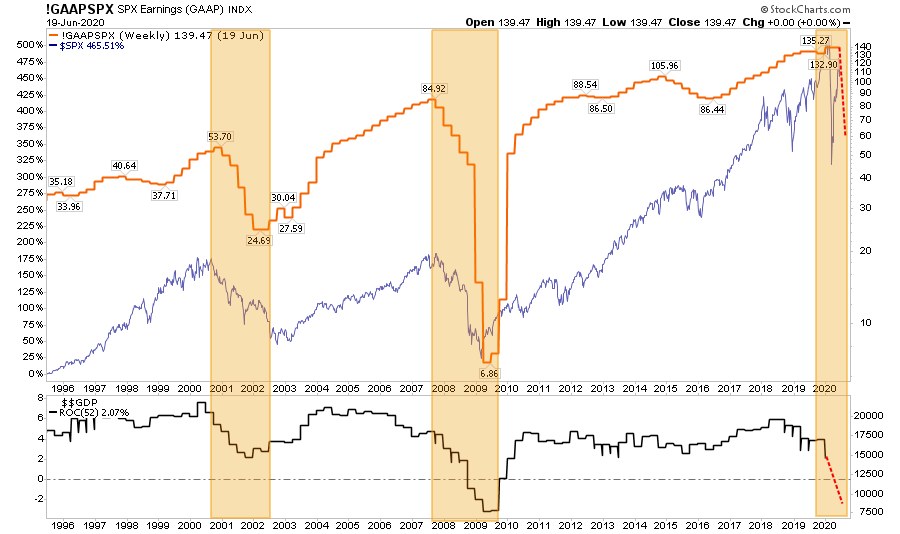
Ultimately, corporate profits and earnings always matter, as discussed previously. (Historically, earnings never catch up with price.)
“Throughout history, earnings are very predictable. Using the analysis above, we can “guesstimate” the decline in earnings, and the potential decline in stock prices to align valuations. The chart below is the long-term log trend of earnings versus its exponential growth trend.”

Fully Invested Bears
The problem in discussing “investment risk” is that such commentary is summarily dismissed as being “bearish,” By extension, I am either sitting in cash or short the market. In either event, I have “missed out” on the previous advance. However, now, the discussion of “risk” is even more futile due to the Fed’s massive interventions.
Such reminds me of something famed Morgan Stanley strategist Gerard Minack said once:
“The funny thing is there is a disconnect between what investors are saying and what they are doing. No one thinks all the problems the global financial crisis revealed have been healed. But, when you have an equity rally as you’ve seen for the past four or five years, everybody has had to participate.
What you’ve had are fully invested bears.”
While the mainstream media continues to skew individual’s expectations by chastising them for “not beating the market,” which is impossible to do, the job of a portfolio manager is to participate in the markets with a bias toward capital preservation. It is the destruction of capital during market declines that have the greatest impact on long-term portfolio performance.
From that view, as a portfolio manager, the idea of “fully invested bears” defines the reality of the markets we live with today. Despite the understanding that the markets are overly bullish, extended, and valued, portfolio managers must stay invested or suffer potential “career risk” for underperformance.
Are Unicorns Real?
What the Federal Reserve’s ongoing interventions have done, and continue to do, is push portfolio managers to chase performance despite concerns of potential capital loss. We have all become “fully invested bears” as we are all quite aware that this will end badly, but no one is willing to take the risk of being grossly underexposed to Central Bank interventions.
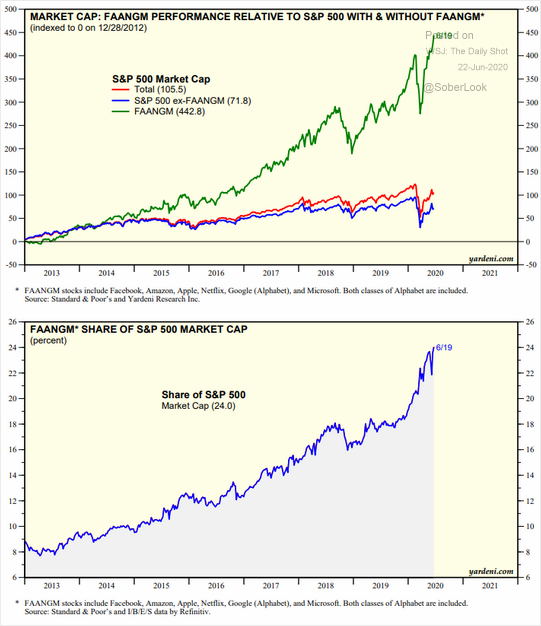
As noted yesterday, retail investors have come to believe in “Unicorns.” As we saw in 1999 and 2007, inexperienced investors are flocking to the market to speculate under the delusion there is no downside risk.
Such is evident when you look at the massive outperformance of just a handful of stocks in the S&P 500 versus the rest of the index. This is not investing. This is purely a function of performance chasing.
Therefore, as “full invested bears,” we must watch the markets carefully for signs of a market turn. Here are the things we are currently watching. These issues do NOT mean the market will crash tomorrow. However, they do always coincide with lower returns and higher volatility.

Valuations
One of the consistent drivers behind the bull market over the last few years has been the idea of the “Fed Put.” As long as the Federal Reserve was there to “bail out” the markets if something went wrong, there was no reason not to invest in equities. In turn, this has pushed investors to “chase yield,” due to artificially suppressed interest rates, It has also pushed valuations on stocks back to levels only seen before the turn of the century.
Furthermore, given the depth of the economic crisis, 49-million unemployed, collapsing wages and incomes, and a resurgence in the number of COVID-19 cases, estimates are still too high. During previous economic downturns, earnings collapsed between 50% and 85%. It is highly optimistic, given the current backdrop, that earnings will only decline by 20%.
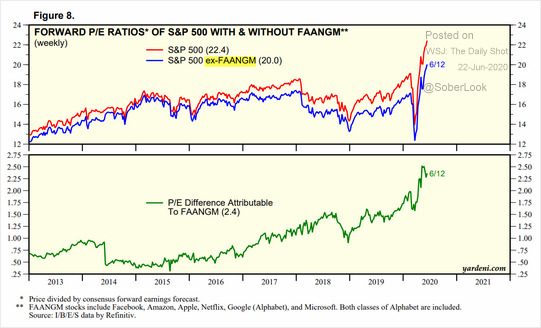
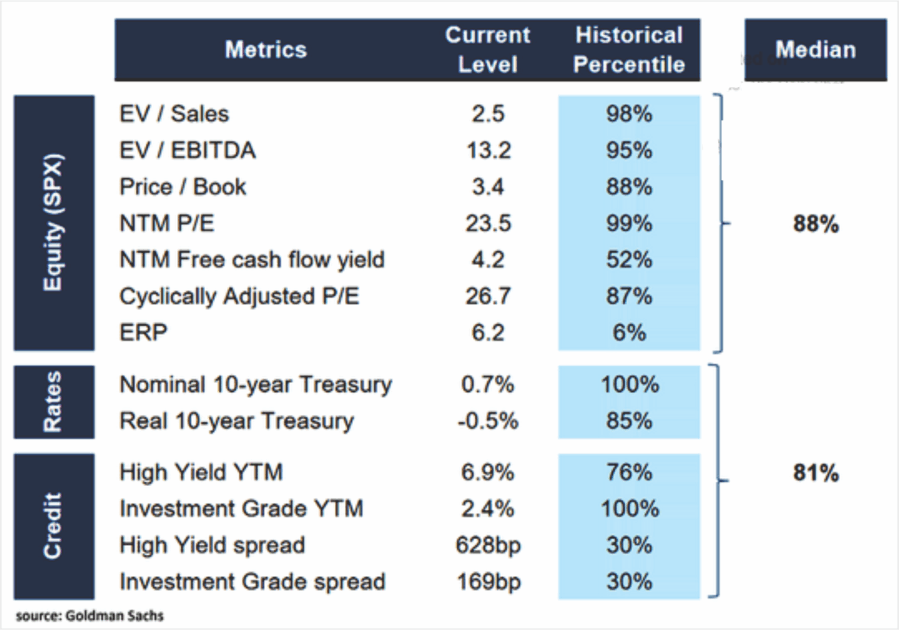
As noted this past weekend, valuations on just about every metric are at the top-end of the range.
“One thing I had hoped for in 2018-2019 is that we would get a correction large enough to revert some of the excessive valuation levels which existed. Such would provide higher future rates of return over the next decade, allowing investors to reach their investment goals.
Instead, through the Fed’s actions, the correction was halted, and the “clearing process” was not allowed to occur. The outcome has been even higher levels of corporate leverage, and valuations remain grossly elevated on many different levels.”
As noted, these valuation extensions are occurring against a backdrop of deteriorating economic growth. The combination, shown in the chart above, has not worked out well for investors in the past.
Under-Estimating Earnings Decline
As noted above, during economic recessions, GAAP earnings tend to decline between 50% and 85% of their previous highs. Given that earnings are a function of revenue, which happens at the top line of the income statement, there is a direct correlation between economic growth, wages, consumption, and corporate earnings.
Currently, estimates have only been reduced by 34% of their previous peak. Such comes at a time where economic growth is weaker, job loss is higher, and consumption will drop lower than any previous point except during the “Great Depression.”
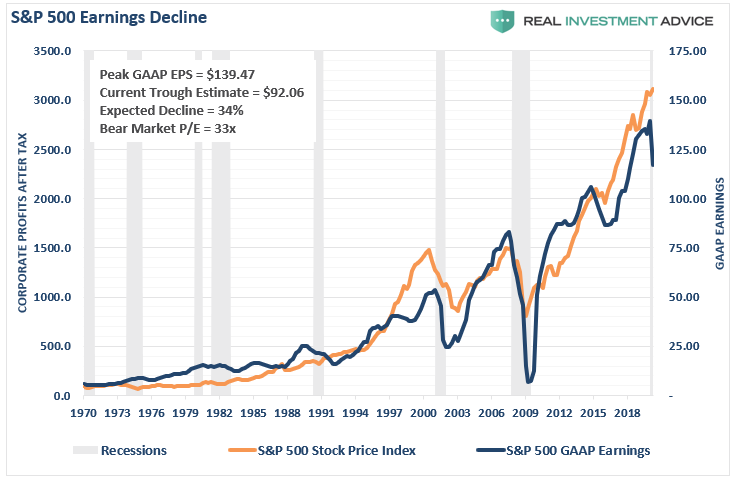
We are watching the chart closely as our expectations are that earnings will eventually drop closer to $60/share to align with historical norms. As such, stock prices will have to correct to align with those earnings.
While Fed liquidity can boost stock prices higher in the short-term, balance sheet expansions do not increase wages, employment, economic growth, or revenue. More importantly, with companies now having to issue stock to raise capital, the biggest support for EPS previously has been removed – stock buybacks.
Deviation
I have written many times in the past that the financial markets are not immune to the laws of physics. What goes up, must and will eventually come down. The example I use most often is the resemblance to “stretching a rubber-band.” Stock prices connect to their long-term trend, which acts as a gravitational pull. When prices deviate too far from this trend, they will eventually “revert to the mean.”
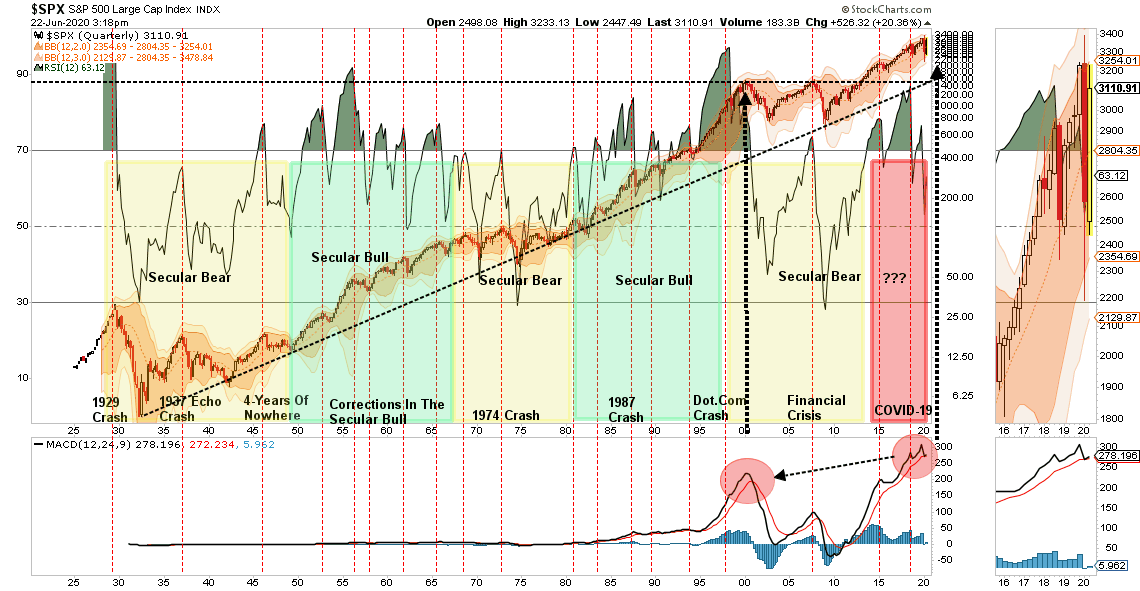
Currently, that deviation from the long-term log trend-line is at one of the highest points in history. Does this mean that the current bull market will crash tomorrow? No. However, it does suggest that “risk” is currently skewed to the downside. It will only take some exogenous, unexpected event, to cause a reversion. As such, some consideration to direct market exposure should be given.
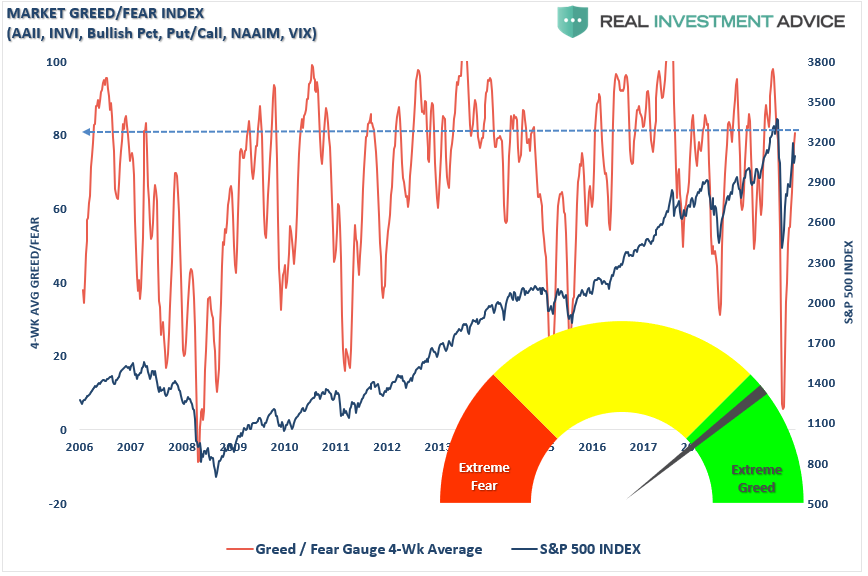
Sentiment
Lastly, is investor sentiment. When sentiment is heavily skewed toward those willing to “buy,” prices can rise rapidly and seemingly “climb a wall of worry.”
Our Greed/Fear indicator is a little different than most. It is based on actual positioning in markets by both amateur and professional investors, plus indicators of positioning sentiment. Rather than it being a “sentiment” gauge, it is a “positioning” gauge.
In March, this indicator plunged to the lowest level seen since the “Financial Crisis.” Just a couple of months later, the indicator is back to “Greed” levels due to the Fed’s monetary interventions. Reading above 80, are typically seen at or near market peaks, corrections, and bear markets.
With sentiment currently at very high levels, combined with low volatility, and a high degree of investor complacency, all the ingredients necessary for a market reversal are currently present. Am I sounding an “alarm bell” and calling for a massive correction? No.
I am suggesting that remaining heavily invested in the financial markets without a thorough understanding of your “risk exposure” will not have the desirable end result you have been promised.
As stated above, my job is to participate in the markets while keeping a measured approach to capital preservation. Since it is “bearish” to point out potential “risks,” then you can call me a “bear.”
Just make sure you understand that I am currently a “fully-invested bear.”
However, that positioning can, and will, rapidly change as needed.
The post Technically Speaking: Unicorns, Rainbows, & Fully Invested Bears appeared first on RIA.
The BullsNBears.com website was founded by market crash expert, Michael Markowski. BullsNBears.com publishes articles by Mr. Markowski and other qualified authors. These articles pertain to bear markets, market crashes, bottoms, recessions and depressions. Register below to be alerted when a new article is published on BullsNBears.com.