
Market bottom? Is it in? That was the main question I got last week, and I even discussed it with Charles Payne of Fox Business. It’s the one answer everybody is searching for. Is it time to “load up the truck” for the next leg of the bull market or go to cash?
It certainly is a problem now, given that January had a rough start for the S&P 500. But, of course, such brings up the age-old Wall Street axiom “so goes January, so goes the year.”
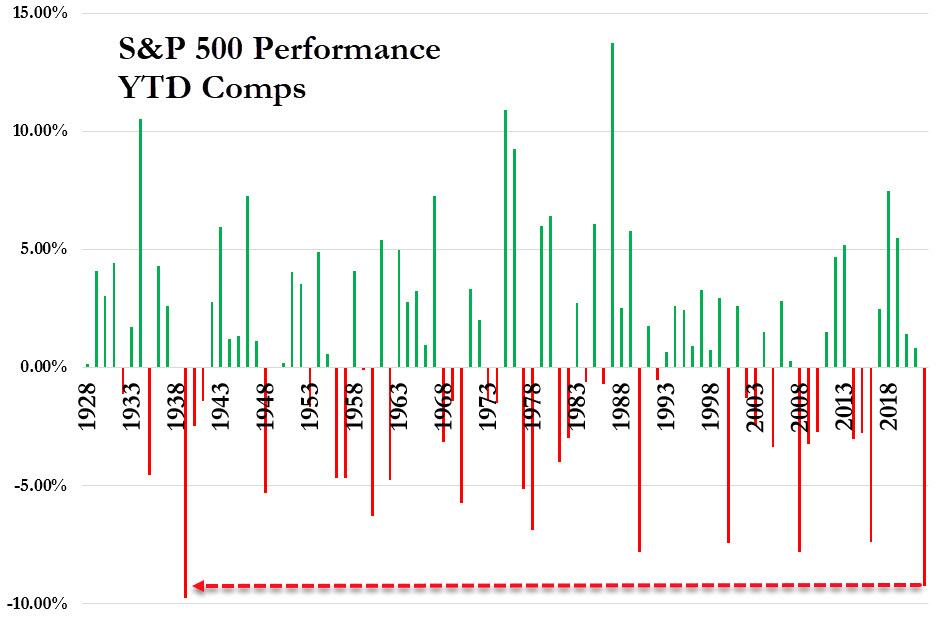
As of this past Friday, the damage is quite apparent. As noted by Zerohedge:
“Nasdaq is down 5 straight weeks (16% from its highs) – the longest losing streak since 2012 – while Small Caps are down 22% from their highs (in a bear market)“
After a year, investors believed they “could do no wrong,” now it seems as if “nothing is going right.”
As I noted previously in “Investor Resolutions,” such is how bull markets work. To wit:
When the “bull is running,” we believe we are smarter and better than we are. As a result, we take on substantially more risk than we realize as we continue to chase market returns and allow “greed” to displace our rational logic. Like gambling, success breeds overconfidence as the rising tide disguises our investment mistakes.
Unfortunately, during the subsequent completion of the full-market cycle, our errors return to haunt us. Always too painfully and tragically as the loss of capital exceeds our capability to “hold on for the long-term.”
Such is where many investors find themselves today, hoping for a return of the bull market to bail them out of bad investment strategies.
So, is a bottom in? First, let’s look at the technical backdrop.
Technically Speaking – A Bottom Is In
In this past weekend’s newsletter, I made the case the market has likely made a short-term bottom.
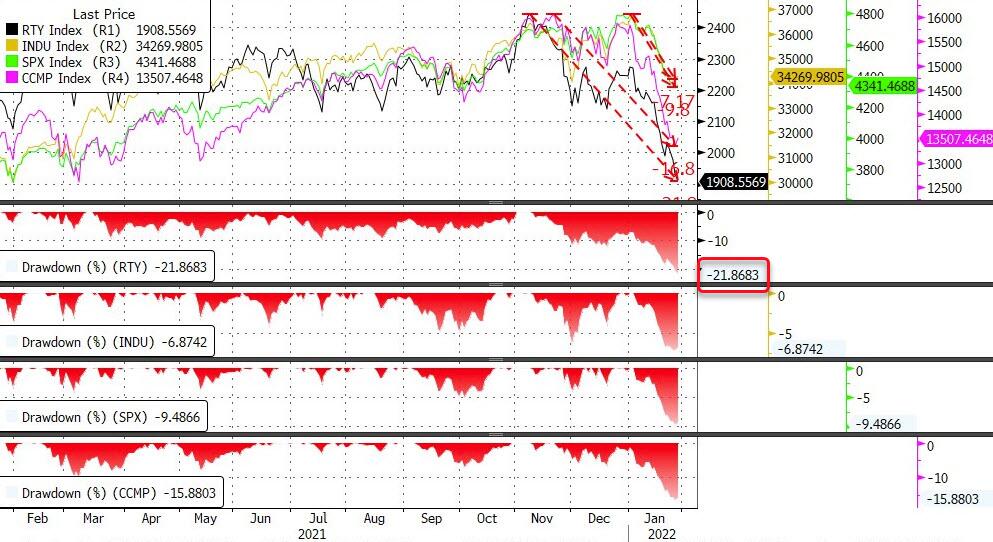
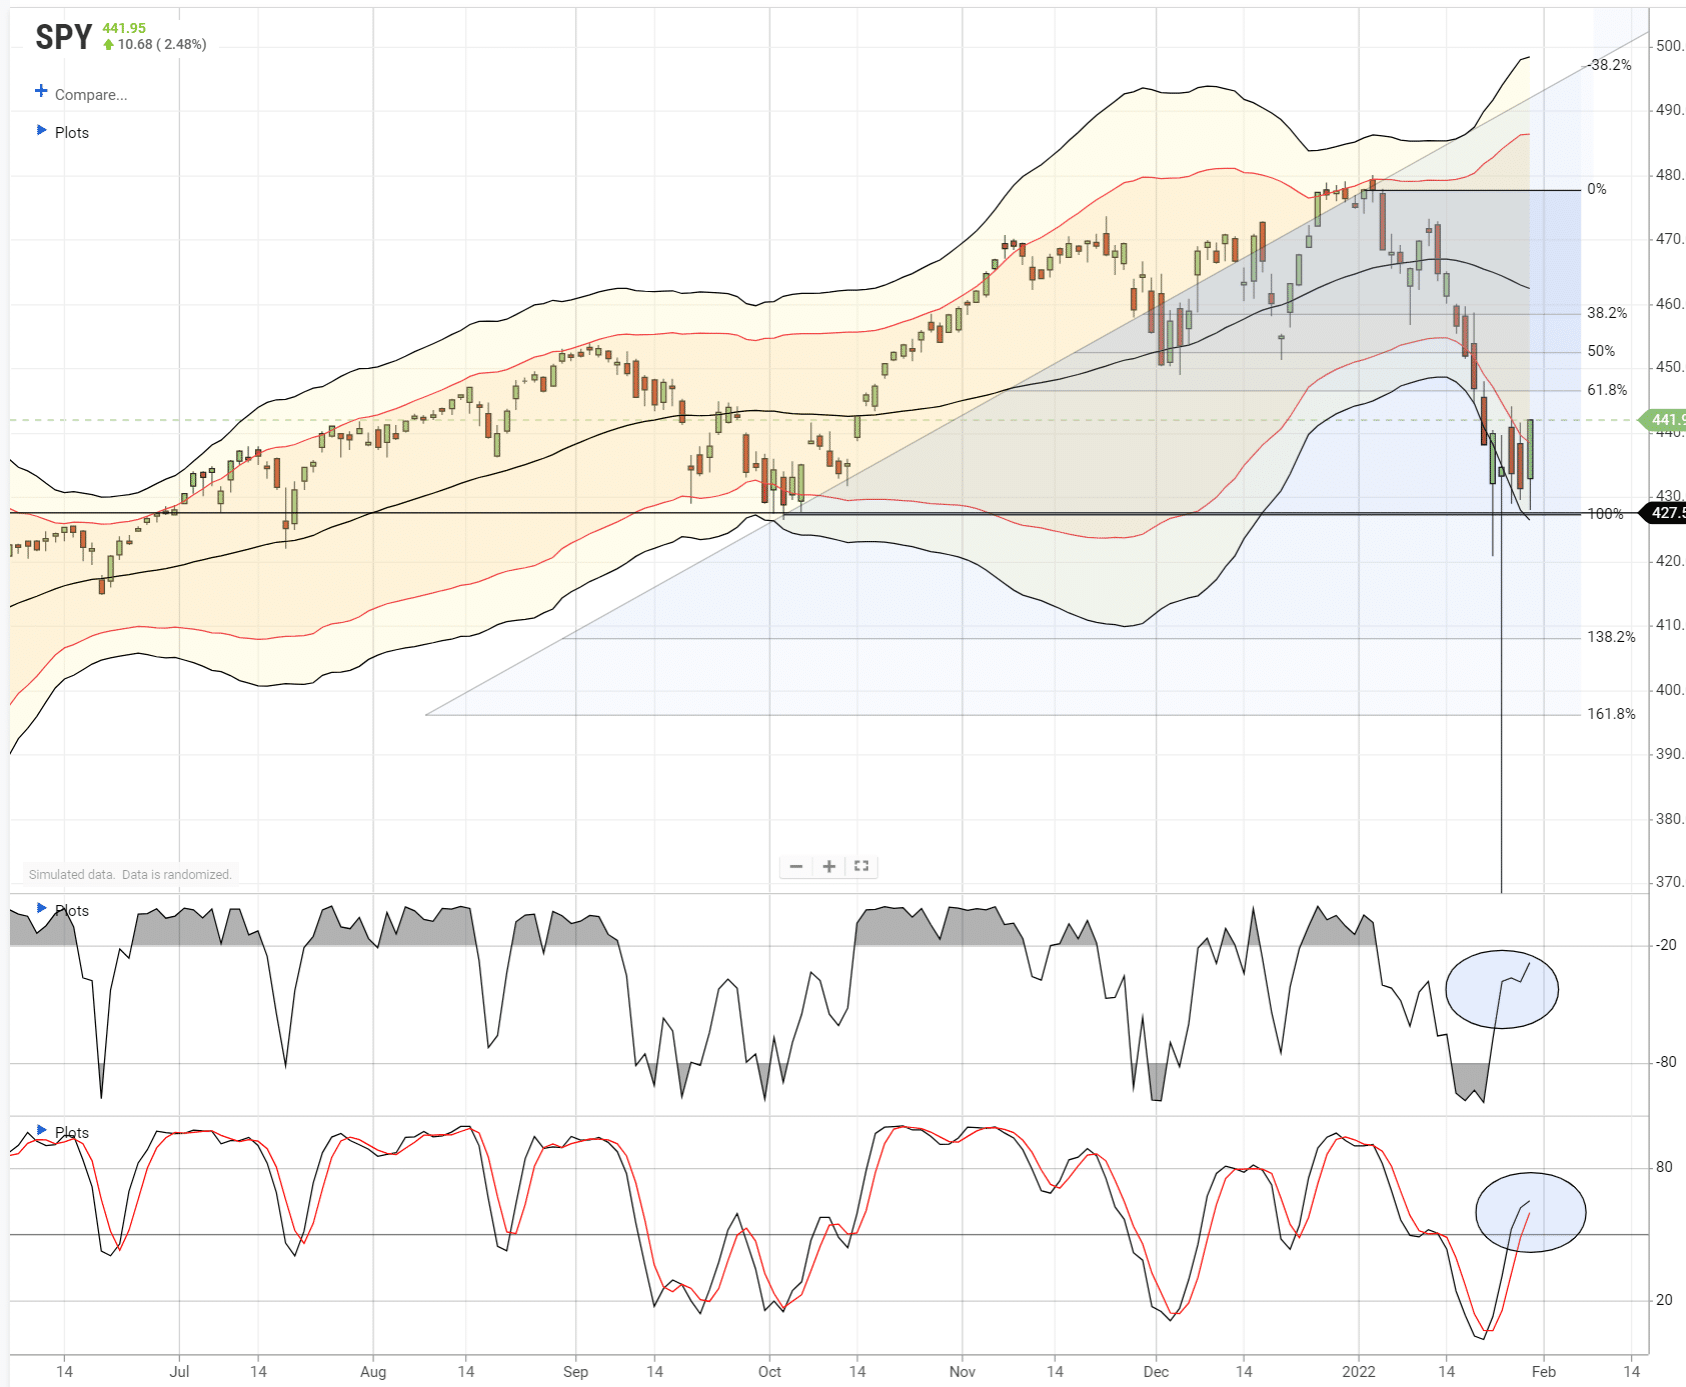
The markets do look to be stabilizing, as shown below, and are holding the October lows. That 100% Fibonacci retracement, and multiple rally attempts, triggered a short-term buy signal. All of this is short-term bullish.
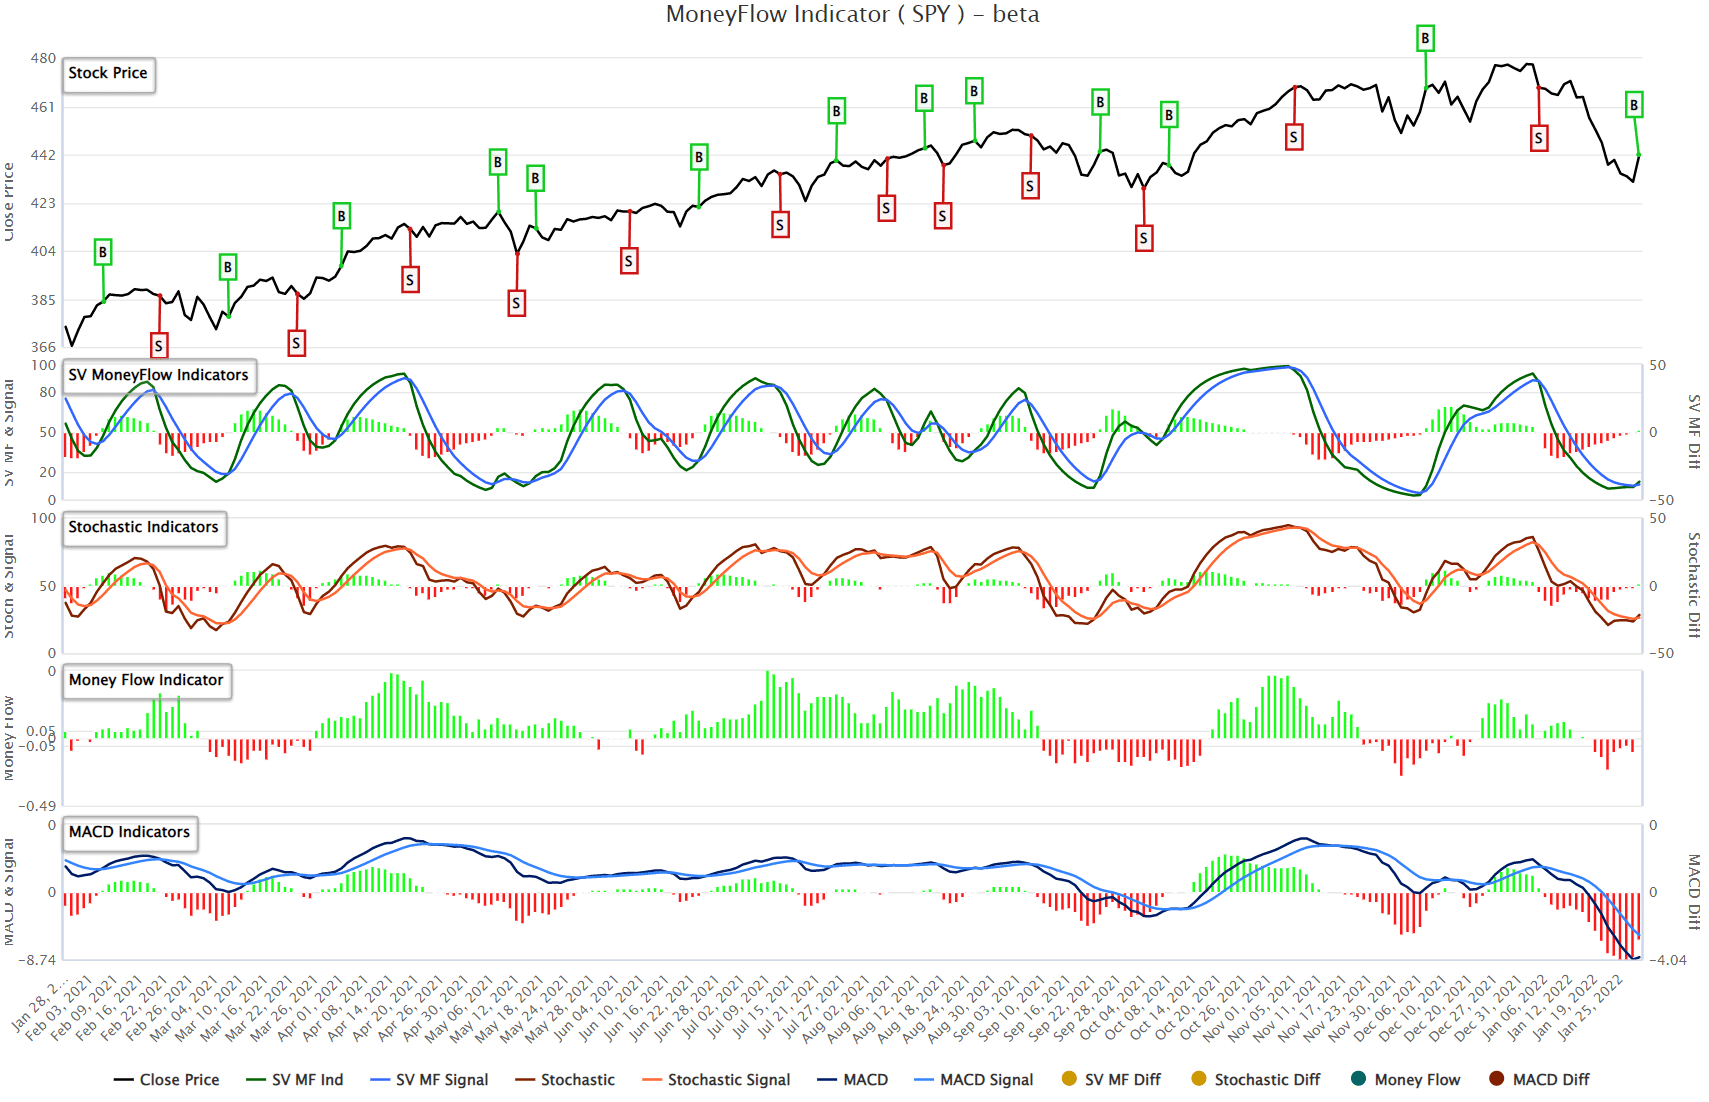
Furthermore, our Simplevisor Money Flow analysis is also at extreme oversold levels. Such usually provides a sustainable rally, particularly when the indicator is at extreme lows and triggering a “buy” signal as it is currently.
However, while the technicals suggest a short-term bottom is getting established, we are concerned that may limit any bounce to a 50% to 61.8% Fibonacci retracement of the recent decline. From Friday’s close, such would entail a further rally of roughly 3-4% before the market runs into the broken 50-day moving average.
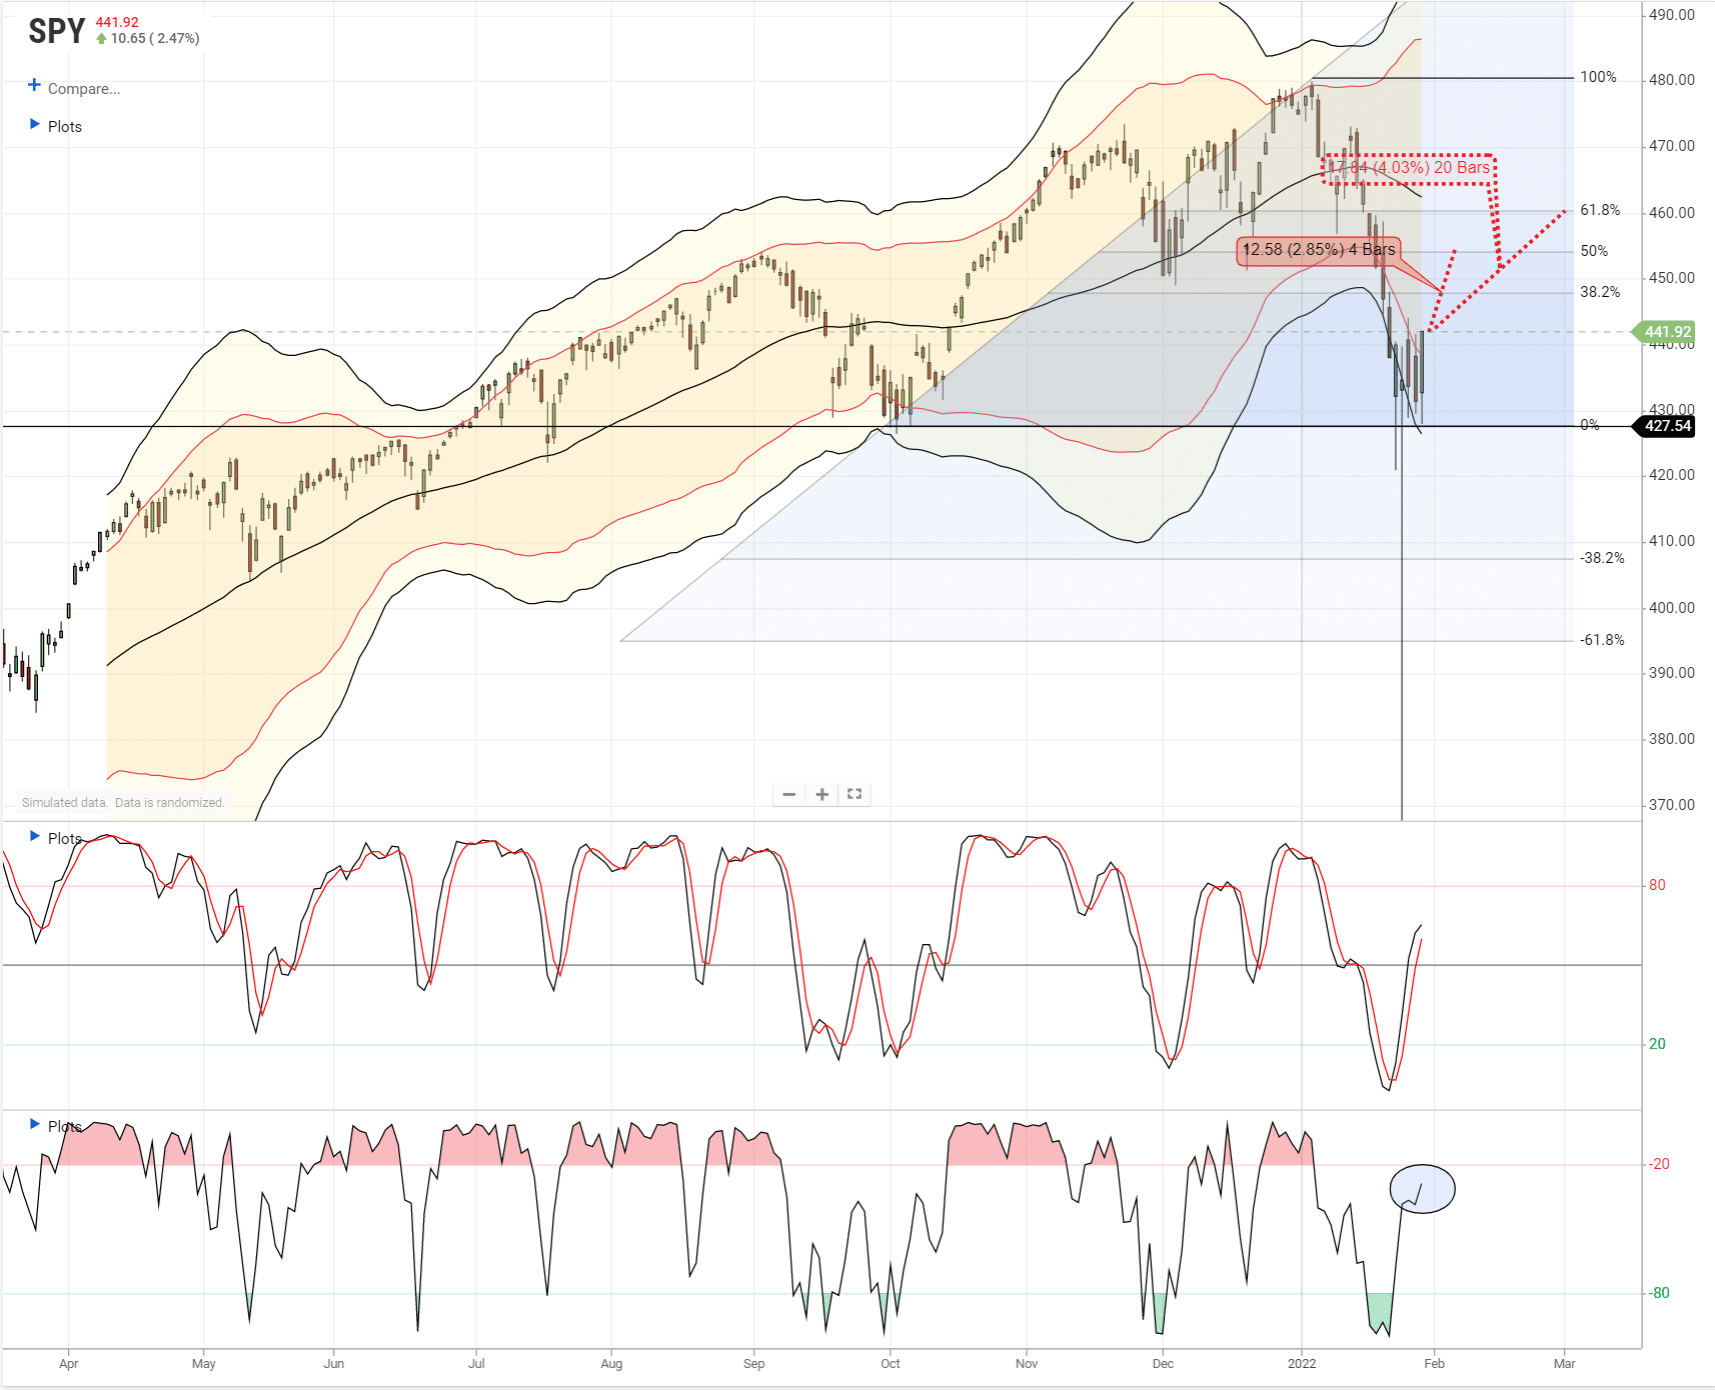
At that juncture, most of the oversold indicators will be back to overbought, and we could potentially see a reversal to retest the recent lows. There are a couple of reasons we suspect such will be the case:
- There are a lot of “trapped longs” that will look to “sell” into the rally.
- A reversal of the previous tailwinds from earnings and economic growth, to tighter monetary policy, liquidity and inflation.
As JP Morgan noted this past week:
‘Given the lack of strong capitulation, it is not yet clear whether this rebound should be any more than short-term and tactical in nature. In addition, how discretionary investors perform if there is a bounce could be critical. Given many captured a large amount of the decline, if they don’t capture most of the rebound, it could continue to create risks.” – via Zerohedge
As is always the case, nothing is a guarantee. But there is a crucial risk developing.
The Dollar Is Key
With inflation surging short-term due to the impact of massive floods of liquidity against a supply-constrained economy, such suggests that the U.S. dollar is just beginning to play catchup. Furthermore, with tensions rising between Russia and Ukraine, it will not be surprising to see global fund flows into U.S. Treasuries, which will push the dollar higher as a “safety trade” for global reserves.
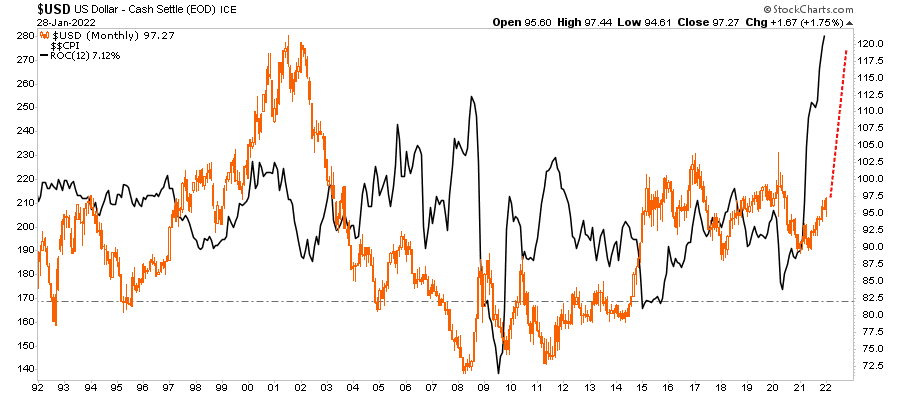
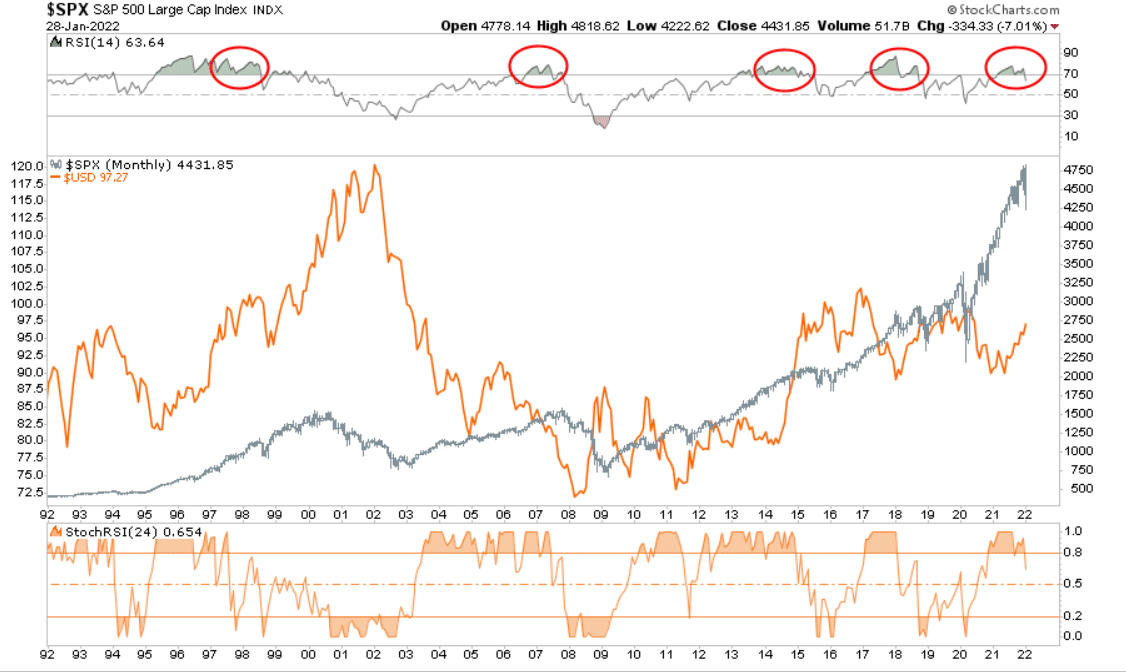
Historically, a surging U.S. dollar undermines both the stock and commodity markets (per our discussion yesterday), as a strong dollar negatively impacts exports which comprise about 40% of corporate revenues.
With the markets extremely overbought, as shown below, such suggests that we could well be in the midst of a more significant correctional process. If such is the case, then we could be seeing a shift in market dynamics from “buying dips” to “selling rallies.”
As we have noted previously, there are more than just a few headwinds facing us in 2022.
- The Fed is reversing liquidity and tightening monetary policy.
- Fiscal policy supports no longer exist.
- Current inflation is impacting consumption
- Economic growth is slowing dramatically (Atlanta Fed GDP Now at 0.1% for Q1)
- Earnings growth will slow.
- Profit margins remain under pressure from higher input costs and wages.
- Valuations remain elevated
These challenges could lead to a more challenging investment dynamic this year.
But the Fed is likely the catalyst to the next correction.
The Fed Is Walking Into A Trap
There are more than a few reasons why we believe that “disinflation” is a more significant threat in 2022 than inflation. With inventories surging and liquidity reversing, prices will fall as a supply glut occurs. As BofA noted recently:
“Inflation is annualizing 9%, and real earnings are falling to a recessionary 2.4%. Stimulus payments to US households are evaporating from $2.8tn in 21 to $660bn, and there is no buffer from excess savings with the rate at 6.9%, which is lower than 7.7% in 2019). There is a huge inventory build in retail products (ex-auto), while the upcoming weak US consumption most likely catalyst for consensus cuts in GDP/EPS.”
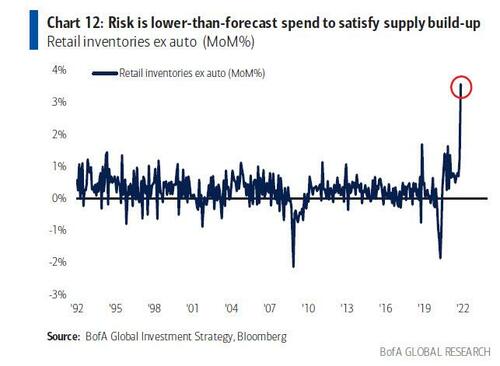
In a simple word, this is very “deflationary.”
However, the Fed intends to hike rates to combat an inflationary surge that has most likely peaked. If such is the case, the Fed is walking into the same trap as before. Notably, the Fed probably won’t be able to hike more than 1% before creating the next crisis.

For all of these reasons, we agree that a short-term bottom may be in as it is “hard to kill a bull market.”
However, investors should use rallies to rebalance risk and take on a more cautionary posture as we head into 2022.
Will there be a time to “start loading up the truck” again? Yes.
“But after a lot more pain, the time to buy will come, and that’s usually marked by the transition from panicking stock markets to panicking Fed officials.” – BofA
The post Market Bottom? Is It In, Or More Downside Coming? appeared first on RIA.
BullsNBears.com was founded to educate investors about the eight secular bear markets which have occurred in the US since 1802. The site publishes bear market investing recommendations, strategies and articles by its analysts and unaffiliated third-party and qualified expert contributors.
No Solicitation or Investment Advice: The material contained in this article or report is for informational purposes only and is not a solicitation for any action to be taken based upon such material. The material is not to be construed as an offer or a recommendation to buy or sell a security nor is it to be construed as investment advice. Additionally, the material accessible through this article or report does not constitute a representation that the investments or the investable markets described herein are suitable or appropriate for any person or entity.